Previous Story
Thursday 9th April: Daily technical outlook and review

EUR/USD:
Weekly timeframe perspective: The weekly timeframe shows that active selling is being seen from just below a major weekly swap level coming in at 1.1096. This, coupled with the fact the Euro is in a stonking great downtrend at the moment does not look good for anyone currently long this market.
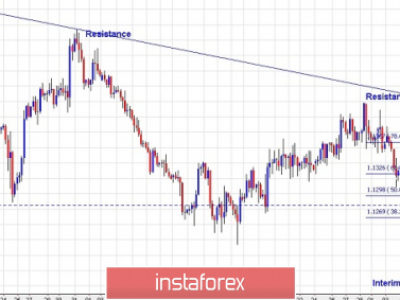
Daily timeframe perspective: From this angle, we can see that by joining in on the selling taking place from just below the aforementioned major weekly swap level may not be such a good idea. The reason for why is simply because price is now trading only a few pips above a daily swap level visible at 1.0716.
4hr timeframe perspective: The EUR/USD pair sold off yesterday from a 4hr swap area coming in at 1.0862-1.0887. This move consequently took out the 1.0800 handle, and slam dunked itself into a small 4hr decision-point demand area at 1.0749-1.0772.
Buying the Euro at its current position is not really something our team would be comfortable doing, especially with potential round-number resistance looming just above at 1.0800. Waiting for price to close above and retest this level would (in our opinion) be a far conservative approach, as this would likely clear the path north for intraday buying back up to at least the aforementioned 4hr swap area. A break below current 4hr demand, however, would effectively be our cue to begin watching for price to retest this area as supply, since the path south would then likely be clear down to 1.0700, which is only 16 pips below the aforementioned daily swap level (see above).
To sum up, we’re primarily looking for intraday moves today. Once the higher timeframes are more in sync with each other again, we’ll begin looking more to medium/long term.
Current buy/sell orders:
- Buy orders: Flat (Predicative stop-loss orders seen at: N/A).
- Sell orders: Flat (Predicative stop-loss orders seen at: N/A).
GBP/USD:
Weekly timeframe perspective: The weekly timeframe shows that not only is the GBP in a freakishly steep downtrend at the moment, but price is also seen lodged just below a recently broken weekly Quasimodo support (now resistance) line coming in at 1.5007. Therefore, for anyone considering buying this pair medium/long-term may want to consider the above before doing so.
Daily timeframe perspective: From a technical standpoint, we have barely seen any change on this timeframe for quite some time now. The key thing (in our opinion) to take away from this chart is that further selling will only take place on the weekly timeframe once the daily demand zone visible at 1.4643-1.4823 is taken out.
4hr timeframe perspective: From this angle, we can see that there were extremely active buyers located just above 1.4800 in yesterday’s sessions (located just within the aforementioned daily demand area). This buying pressure managed to push price above 1.4900, and hit a 4hr Quasimodo resistance line at 1.4953, which, as you can see, was clearly enough to support a counterattack back below 1.4900 towards the mid-level mark 1.4850.
Given both the current location of price at the moment on the 4hr timeframe, and the tug-of-war scenario taking place between the weekly and daily timeframes (see above), trading this pair this pair should be done so with caution. With that said, intraday setups will be our main focus until we see more of an agreement on potential future direction from the higher timeframes. Levels we currently have our eye on for short-term bounces are as follows:
- Buys:
- The round number 1.4800 (located just within the aforementioned daily demand area).
- The 4hr decision-point demand area at 1.4721-1.4767 (located within the aforementioned daily demand area).
- Sells:
- The round number 1.4900.
Current buy/sell orders:
- Buy orders: 1.4800 [Tentative – confirmation required] (Predicative stop-loss orders are seen at: dependent on where one confirms this level) 1.4721-1.4767 [Tentative – confirmation required] (Predicative stop-loss orders are seen at: 1.4714).
- Sell orders: 1.4900 [Tentative – confirmation required] (Predicative stop-loss orders are seen at: dependent on where one confirms this level).
AUD/USD:
Weekly timeframe perspective: Over the past two months or so, the buyers and sellers have been seen pulling for position within a weekly demand area at 0.7449-0.7678, which, as you can see, also boasts long-term trendline convergence from the low 0.4775. We’re not usually one to make predictions here, but with the lower low that formed last week deep within the weekly demand at 0.7532, coupled with the fact that the Aussie is in a severe downtrend at the moment, it looks as though this area will be taken out sooner or later.
Daily timeframe perspective: From this angle, we can see active buying recently took place from a daily demand area at 0.7449-0.7598 (located deep within weekly demand at 0.7449-0.7678). Assuming this bullish tempo continues today, potential resistances to keep an eye on are the downtrend line extended from the high 0.8294, and the daily supply area seen above it at 0.8024-0.7883.
4hr timeframe perspective: The 4hr timeframe shows that a decisive push above a 4hr decision-point supply area at 0.7699-0.7682 was seen in yesterday’s sessions. This move has potentially cleared the path north up to at least 0.7762. This, along with price trading around both weekly and daily demand zones (see above) at the moment may lead to a rally in prices. To take advantage of this potential up move, we’re looking to buy from the freshly-baked 4hr demand area sitting below at 0.7626-0.7649. Our team has deemed this a place fit for a pending buy order, which we’ve placed a little above the zone at 0.7652, with a stop set just below at 0.7622.
Nonetheless, risk management has only allocated us with 50% of our usual position here for the following reasons:
- The current state of the weekly demand area – let’s be honest, it’s not exactly oozing with buying strength at the moment!
- Let’s also not forget the Aussie’s overall trend is not exactly favorable to trading long right now (see above).
It will be interesting to see how this pans out…

Current buy/sell orders:
- Buy orders: 0.7652 (Predicative stop-loss orders seen at: 0.7622).
- Sell orders: Flat (Predicative stop-loss orders seen at: N/A).
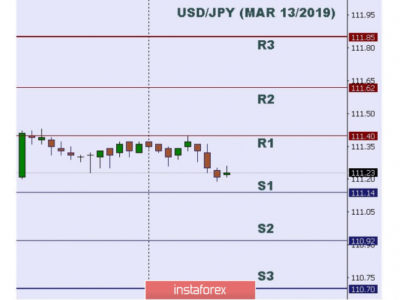
USD/JPY:
Weekly timeframe perspective: Along with the overall trend still firmly pointing north, buying pressure is being seen from deep within a small weekly decision-point demand area at 118.22-119.40. In the event that the buyers can continue with this tempo, it’s likely we’ll eventually see prices challenge the weekly Quasimodo resistance level seen at 122.18.
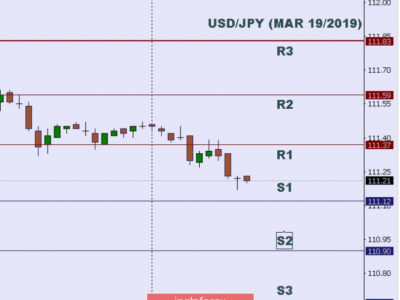
Daily timeframe perspective: The daily timeframe shows price is currently nibbling at the underside of a minor daily supply area seen at 121.18-120.08. A convincing push above this barrier could very well be the catalyst needed for a move up to the aforementioned weekly Quasimodo resistance level.
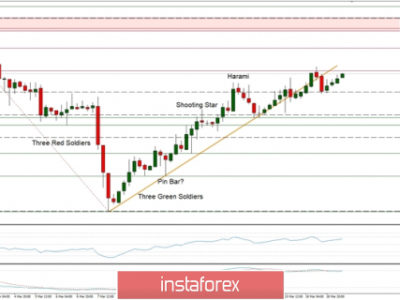
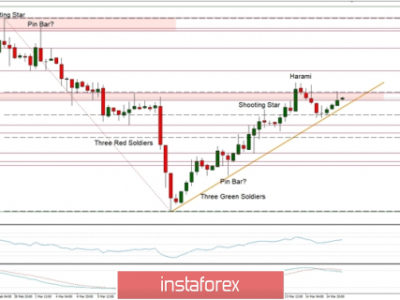
4hr timeframe perspective: From the 4hr timeframe, we can see that price sold off during yesterday’s sessions. This move consequently tested the 4hr decision-point demand area at 119.42-119.67, which, as you can see, was clearly enough to support a counterattack back up to 120.21.
Our team is only prepared to begin buying this market if price manages to close above and retest 120.21 as support – waiting for lower timeframe confirmation is strongly advised here. Now, you may be thinking that by buying here, we’d be buying into daily supply, right? You’d be correct in your thinking. However, let’s not forget that even though we’re effectively buying into daily supply, we’re also buying WITH the weekly trend and from a weekly decision-point demand area (for levels see above), as in our experience the higher timeframes usually take precedence.
Taking all of the above into consideration, we have no interest in selling this market at this time.

Current buy/sell orders:
- Buy orders: Flat (Predicative stop-loss orders are seen at: N/A).
- Sell orders: Flat (Predicative stop-loss orders are seen at: N/A).
USD/CAD:
Weekly timeframe perspective: Although the view from the weekly timeframe shows price in a firm uptrend, over the last two months or so price has been seen teasing the underside of a weekly Quasimodo resistance level coming in at 1.2765, which as you can see, is proving a tough nut to crack! Let’s take a look at the lower-timeframe structure to see what we can find…
Daily timeframe perspective: From the daily picture, we can see that this pair is clearly beginning to chisel out a consolidation zone between the daily demand area at 1.2350-1.2468, and a daily supply area seen at 1.2833-1.2742 (encapsulates the aforementioned weekly Quasimodo resistance level). The current location of price is around the lower limit of this range, so any traders looking to sell medium/long term may want to make a note of this.
4hr timeframe perspective: The 4hr timeframe shows that price aggressively faked below a 4hr demand area at 1.2408-1.2450 (located within the aforementioned daily demand area) during yesterday’s sessions. This fakeout, as you can probably see, found enough supportive pressure from the low 1.2386 formed on the 26/02/15 to aggressively smash through 1.2500, and extend up to a small 4hr decision-point supply area seen at 1.2572-1.2553.
Given that there is somewhat of a tug-of-war going on between the weekly and daily timeframe structures (see above) at the moment, selling from the current 4hr decision-point supply area is not something we’ll be taking part in unless lower timeframe selling confirmation is presents itself. Should a sell signal be seen, targets coming in for this trade are as follows: 1.2520, 1.2500 and potentially the aforementioned 4hr demand area below.
A close above this 4hr area, however, would likely leave the path north relatively free for intraday buying up to at least 1.2600. We’d only consider trading this move if price retested the supply as demand, and showed us some form of confirming price action on the 5/15 minute timeframes.

Current buy/sell orders:
- Buy orders: Flat (Predicative stop-loss orders seen at: N/A).
- Sell orders: 1.2572-1.2553 [Tentative – confirmation required] (Predicative stop-loss orders seen at: 1.2575).
USD/CHF:
Weekly timeframe perspective: The current situation on the weekly timeframe shows price is now retesting the 0.9663 weekly swap (resistance) level. In the event that the sellers can hold the market lower here, we might, just might, see price challenge the weekly decision-point demand area seen below at 0.9170-0.9343.
Daily timeframe perspective: From this angle, we can see price teasing the underside of a daily supply area at 0.9755-0.9662 (located just above the aforementioned weekly swap [resistance] level). Should this area be taken out, the path north would then likely be clear for the market to test a small daily decision-point supply area at 1.0090-1.0008.
4hr timeframe perspective: The 4hr timeframe is currently showing some very interesting price action. Recent movements have allowed a 4hr demand area to form at 0.9596-0.9622, which we believe will see a rebound if hit. The reason for why is simply because price has just spiked above the high 0.9672, which in turn likely cleared the path north for an intraday move towards 0.9700, and this near-term structural 4hr demand area will likely be where price drops down to collect buyers before rallying higher (as per the red arrows).
Now, we know that by buying here, we’re potentially going against not only Weekly resistance, but also daily supply as well (see above); this is why we’re only intending to trade a small position here, and will only enter if lower timeframe price action confirms strength resides here. It will be interesting to see what today brings…

Current buy/sell orders:
- Buy orders: 0.9596-0.9622 [Tentative – confirmation required] (Predicative stop-loss orders seen at: 0.9591).
- Sell orders: Flat (Predicative stop-loss orders seen at: N/A).
DOW Jones 30 (US 30):
Weekly timeframe perspective: From the weekly timeframe, we can see that the DOW is in an incredibly strong uptrend at the moment, and has been for the past six years! That being said though, price has recently hit a resistance barrier coming in around the 18098 region, which is currently holding the market lower. It will be interesting to see what the lower timeframes make of this…
Daily timeframe perspective: Price action on the daily timeframe is currently being supported by a small, yet clearly resilient daily decision-point demand area at 17561-17655 (trendline convergence seen from the low 15849). Considering the overall size of this daily area, we have seen this barrier defended not once, not twice, but THREE times now.
4hr timeframe perspective: From a technical standpoint, the DOW has not really changed much on this timeframe, as price still remains swinging between a 4hr supply area at 18009-17939 and the minor 4hr swap level coming in at 17870.
A break above the aforementioned 4hr supply area would likely open the gates to intraday buying up to the 18098 weekly level, which we would take part in as long there was supporting lower timeframe confirmation. For us to be confident that the overall trend is continuing, however, we’d need to see a sustained move above this weekly level on the 4hr timeframe before seriously committing to longs.
Conversely, a push below and retest of 17870 would essentially be our cue to begin shifting over to shorts. Lower timeframe confirmation would be required here, since we’d effectively be trading against the overall trend here (see above). Assuming that a confirmed retest is seen, we’d look towards the 17811 level for a first take-profit target. If 17811 gives way, our second and final take-profit target would be set around the 4hr demand area at 17546-17633 (located deep within the aforementioned daily decision-point demand area).

Current buy/sell orders:
- Buy orders: Flat (Predicative stop-loss orders seen at: N/A).
- Sell orders: Flat (Predicative stop-loss orders seen at: N/A).
XAU/USD (Gold):
Weekly timeframe perspective: From the weekly timeframe, we can see that the overall trend is firmly pointing south. In spite of this, price recently pierced above a small weekly decision-point supply area at 1223.1-1202.6, which has very likely cleared the path north for further upside towards a weekly swap level coming in at 1251.0.
Daily timeframe perspective: The recent move on the weekly timeframe also broke above a daily supply area at 1223.1-1213.0 (located deep within the aforementioned weekly decision-point supply area). This push higher, as per the daily timeframe, has potentially cleared the runway north up to daily supply at 1236.6-1227.7, which is, as far as we can see, now effectively a key obstacle to a move towards the aforementioned weekly decision-point supply area. In addition to this, we can also see that should active buyers come into the market, they will likely do so much lower down, around the major daily swap level region 1182.00 since between the current location of price and here, this is the only logical buy zone in our opinion.
4hr Timeframe perspective: Following the break above the 4hr resistance zone at 1223.1-1219.0 (located deep within the daily supply area mentioned above at 1223.1-1213.0) on Monday, the Gold market sold off, consequently taking out the 1208.4 level, and slamming head first into a 4hr demand area at 1194.8-1199.8.
Although the overall trend on Gold is pointing south at the moment, we have seen (bold points above) three supply areas engulfed with room above for prices to move higher in the short term. This can be seen not only on the weekly timeframe, but the daily and 4hr timeframes as well. So, with a potential resistive-free area on the horizon, we’re going to keep a close eye on the following areas today for lower timeframe buying confirmation:
- The aforementioned 4hr demand area, which also boasts 4hr trendline support from the low 1142.5.
- The small 4hr decision-point demand area at 1191.3-1194.1.
Should a buy signal be taken from either of the above areas, the first take-profit target will be set around the 4hr decision-point supply area seen at 1212.2-1209.0. The second will likely come in at 1218.1, seen just below the aforementioned 4hr resistance zone. The third and final target will be set at 1226.5, positioned just below the daily supply area mentioned above at 1236.6-1227.7.

Current buy/sell orders:
- Buy orders: 1194.8-1199.8 [Tentative – confirmation required] (Predicative stop-loss orders seen at: 1194.4). 1191.3-1194.1 [Tentative – confirmation required] (Predicative stop-loss orders seen at: 1190.2).
- Sell orders: Flat (Predicative stop-loss orders seen at: N/A).
The post Thursday 9th April: Daily technical outlook and review appeared first on .
Source:: Thursday 9th April: Daily technical outlook and review