Previous Story
Trading plan for EUR/USD for February 12, 2019
Technical outlook:
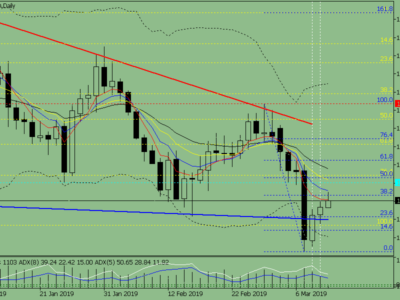
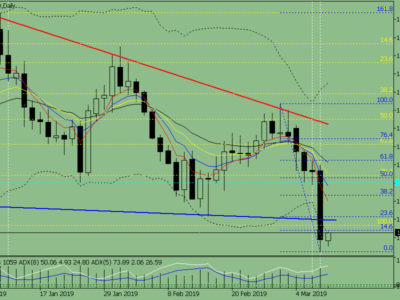
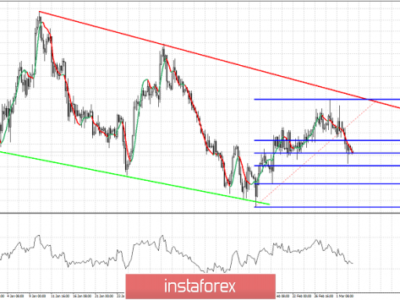
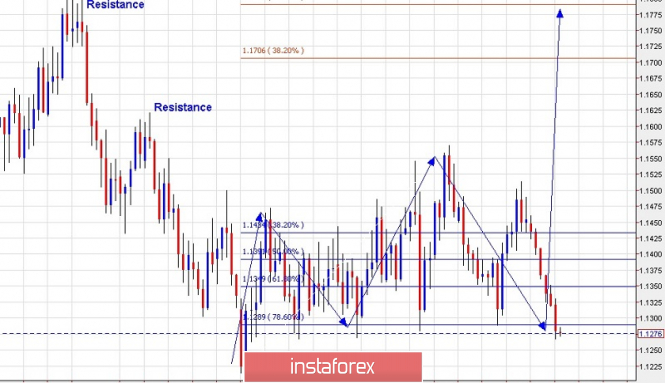
We have presented the Daily chart for EUR/USD since September 24, 2018 till current date, to have a larger view of the potential swing. As seen here, EUR/USD formed interim support at 1.1215 levels on November 12, 2018 and since then it has been producing a very complex corrective and sideways price action. We have simplified the swing here into 2 parts: The rally between 1.1215 and 1.570 levels is considered as the recent swing that is being worked upon. Further, the subsequent drop from 1.1570 through 1.1268 can be viewed as a corrective drop. Please also note that the correction has stalled at a fibonacci 0.786 retracement of the previous swing discussed here. If prices remain above 1.1215 levels going further, and a bullish reversal is seen around current price action, the EUR/USD bulls shall be back in play and push prices higher towards 1.1800 levels.
Trading plan:
Initiate fresh longs between 1.1260/80, stop below 1.1215, target is 1.1800.
Good luck!
The material has been provided by InstaForex Company – www.instaforex.com