
Previous Story
Trading plan for Gold for Mar 31, 2020
Technical outlook:
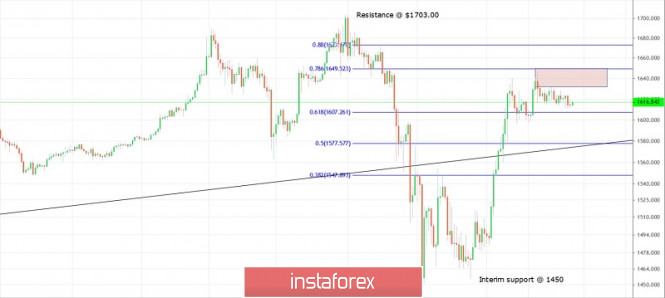
Gold is seen to be trading around $1,615 levels at this point in writing with a negative bias, looking to break down below $1,600 levels. The rectangle highlighted on the above chart is resistance zone for any intraday rallies. The overall structure remains bearish for the yellow metal until prices stay below $1,703 levels. Immediate resistance is seen at $1,703, while interim support is seen around $1,450 levels respectively. The recent boundary being worked upon is between $1,703 and $1,450. As seen here, Gold has risen through the fibonacci 0.618 retracement and almost reached the 0.786 resistance before pulling back. Another spike might push prices through $1,649/50 levels before reversing sharply. Please note that fibonacci extensions are pointing towards $1,298 levels going forward. If we go by the time line taken to form the above wave structure since $1,703 highs, Gold prices remain poised to reach $1,298 levels in the next 4-5 weeks.
Trading plan:
Remain short from yesterday @ $1,615/25. stop @ 1,703 target @ 1,298
Good luck!
The material has been provided by InstaForex Company – www.instaforex.com


