
Previous Story
Trading recommendations for GBP/USD pair on Feb 6, 2020

From the point of view of a comprehensive analysis, we see continued activity in the financial markets, where an attempt was made once again to break down the psychological level of 1.3000, and now let’s talk about the details. The downward interest resumed after a slight pullback to 1.3055, as if it had never been. The quote instantly formed a pulsed-inertial candle, where we were found below the level of 1.3000 in a matter of two hours. The most remarkable point was that the price fixing below the control value of 1.2960 [relative to the H4 timeframe] did not occur again. It is worth noting that we have an extremely strong concentration at the psychological level of 1.3000 for seven weeks. This is a very similar situation with the period 08.03.19 – 05.10.19, where a similar amplitude was formed. Based on the above judgment, the theory follows associated with the regularity of this period relative to the control level of 1.3000. Thus, successive attempts to break down the level of 1.3000 with a regular amplitude can lead to a breakdown of the ill-fated coordinate, which, as a fact, will result in an inertial move. It is worth considering that this is a theory, and if you refer to its possible implementation, then you should not expect quick changes, for a start we should fix a breakdown of the boundaries of the level of 1.3000 and only after that make a layout.
In terms of volatility, we see a holding acceleration, where we have extremely high indicators for the fifth day in a row, which we cannot do anything but rejoice. In fact, trading volumes are still at their best, and I do not exclude the possibility that such a positive mood will still remain on the market.
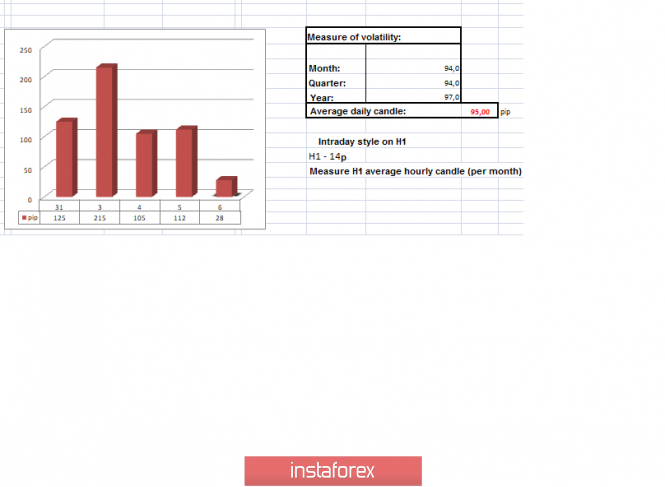
Details of volatility: Thursday – 131 points; Friday – 125 points; Monday – 215 points; Tuesday – 105 points; Wednesday – 112 points. The average daily indicator relative to the dynamics of volatility is 95 points [see table of volatility at the end of the article].
Detailing minute by minute, we see that the main downward jump occurred in the period 12:30–13:30 [UTC+00 time on the trading terminal]. After which, a partial recovery was recorded slightly above the level of 1.3000, followed by a slowdown.
As discussed in the previous review, speculators won, since such an active market makes it possible to snatch quick profits. The tactics of conducting the operation were divided into two methods: the first was suitable for speculators, where entry into positions was made at the slightest appearance of an impulse, with entry through the market; the second option was considered in terms of the main positions, in the case of fixing the price lower than 1.2960 for H4, which did not happen.
Considering the trading chart in general terms [the daily period], we see conditionally horizontal movement along the psychological level of 1.3000, where the medium-term upward trend has not updated its highs as much as 38 trading days.
The news background of the past day contained the final PMI data for Britain, where the composite index showed an increase from 49.3 to 53.3, and the index of business activity in the services sector rose from 50.0 to 53.9 with a forecast of 52.9. In fact, the pound still managed to slightly roll back in a positive direction on the basis of current indicators, but then the movement slowed down. The main impulse of the day was the ADP report on the level of employment in the private sector of the United States, where they forecast a decrease in comparison with the period earlier, but in the end received an increase, [199 thousand —> 291 thousand.] In turn, the US dollar began to grow almost immediately in relation to all currencies, having a local rally.
In terms of the general informational background, we see the furious Brexit, where after its conditional accomplishment, London is no longer so timid in terms of statements that it clearly scares investors. Thus, investors remembered the possibility of a “female” exit, which put pressure on the pound again after Prime Minister Boris Johnson spoke to British businessmen, loudly announced England’s firm position in the upcoming negotiations.
“The conclusion of a trade agreement with Brussels does not mean that London is an example of EU standards in the field of competition, subsidies, ecology or fisheries. We will agree so that the autonomy of our right system will not be affected. Following the example of Canada, Australia, whose economies are weakly connected with Europe and have zero trade tariffs with the EU.” said Boris Johnson during his speech.
In turn, such high-profile statements were answered almost immediately by the EU’s chief negotiator Michel Barnier, giving Johnson an opportunity to come to his senses. Later, a comment appeared from the European Commissioner for Agriculture, Phil Hogan, who was at a loss for Johnson’s remarks regarding the deal with Australia.
“We do not have an agreement with Australia. I think this is a coded designation of an exit without a deal, “said Phil Hogan.
Moreover, London’s actions in the person of Boris Johnson do not end there. So, the media reported that Johnson plans to rewrite the 1998 law and potentially even terminate the country’s participation in the European Convention on Human Rights. Brussels immediately responds to the next high-profile statement, recalling that London may lose the opportunity to cooperate with European judicial and law enforcement agencies.
Today, in terms of the economic calendar, we have data on applications for unemployment benefits in the United States, where no major changes are expected according to forecasts. The initial +3 thousand and the second -8 thousand.
Further development
Analyzing the current trading chart, we see a fluctuation within the region of the psychological level of 1.3000, where the quote is clearly getting considerable pressure. In fact, market participants switch to monitoring mode again, since the chance of a rebound, as well as breakdown, is great and I really do not want to miss this interesting moment. If we make a reference to the regularity of the past, which was written at the beginning of the article, then there is a chance of a fracture as never before. We need to stay below the level where the appearance of the slightest background may cause inertia. In any case, the speculative tactics of working at the jump are still relevant, so there is an opportunity to earn profit.
From the point of view of the emotional mood of market participants, we see the persisting FOMO syndrome [syndrome of lost profit], of course, not on such a scale; nevertheless, it exists. The most pronounced syndrome will come in case of breakdown of the control area.
By detailing the per minute portion of time, we see an attempt to return the quote above the psychological level, but the activity is still extremely small.
In turn, speculators continue to monitor market jumps, where at the slightest occurrence of inertia will enter the market position. In turn, the monitoring of the value of 1.2960 is carried out in terms of the main positions.
Having a general picture of actions, it is possible to assume a fluctuation along the psychological level of 1.3000, where the boundaries of the region remain unchanged within 1.2960 / 1.3055. The tactics of work depends solely on your approach, if you are willing to take a risk, then work on jumps, regardless of the direction, recently it is profitable for the crane. If you are a conservative trader, then sit outside the market and monitor the key points [1.2960/1.3055] for price fixations.
Based on the above information, we derive trading recommendations:
– Buy positions are considered in case of price fixing higher than 1.3055.
– Sell positions are considered in case of price fixing lower than 1.2960, not a puncture in the shadow of a candle.
The recommendations are related in terms of a conservative approach.
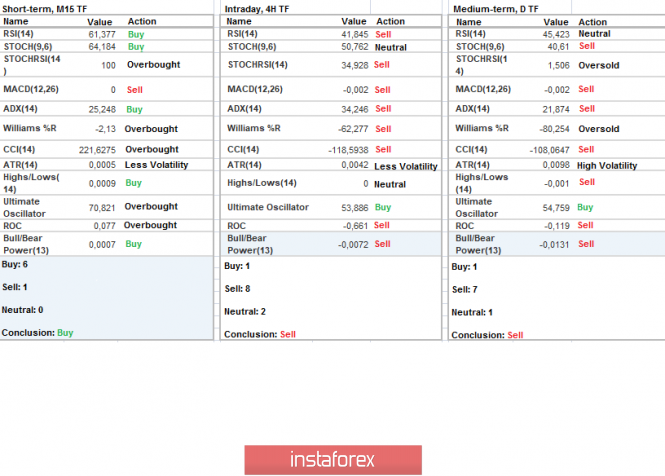
Indicator analysis
Analyzing a different sector of timeframes (TF), we see that the performance of technical instruments is mainly focused on lowering. Minute intervals take a variable position due to the stop.
Volatility per week / Measurement of volatility: Month; Quarter; Year
Measurement of volatility reflects the average daily fluctuation, calculated for the Month / Quarter / Year.
(February 6 was built taking into account the time of publication of the article)
The current time volatility is 28 points, which is a low indicator for this time section. There is a chance of acceleration, as well as an excess of the average. The only risk is a temporary accumulation along the psychological level, which will lead to a decrease in volatility.
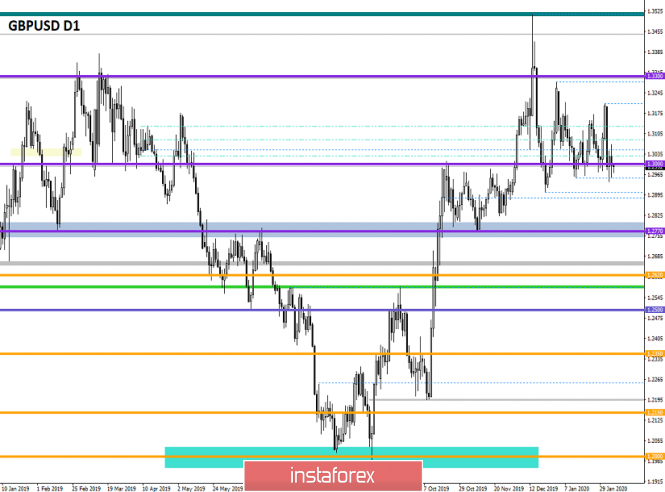
Key levels
Resistance zones: 1.3170 **; 1.3300 **; 1.3600; 1.3850; 1.4000 ***; 1.4350 **.
Support Areas: 1.3000; 1.2885 *; 1.2770 **; 1.2700 *; 1.2620; 1.2580 *; 1.2500 **; 1.2350 **; 1.2205 (+/- 10p.) *; 1.2150 **; 1,2000 ***; 1.1700; 1.1475 **.
* Periodic level
** Range Level
*** Psychological level
**** The article is built on the principle of conducting a transaction, with daily adjustment
The material has been provided by InstaForex Company – www.instaforex.com
Source:: Trading recommendations for GBP/USD pair on February 6


