Previous Story
Tuesday 12th May: Daily technical outlook and review.

EUR/USD:
Weekly view: The weekly timeframe shows that the buyers and sellers continue to battle for position in between a weekly supply zone coming in at 1.1449-1.1278, and a weekly swap level seen at 1.1051. The past two months have been the most we’ve seen the Euro pair rally since price began its descent back in May 2014. In spite of this, our long-term bias still remains south and will continue to do so until we see a convincing push above the aforementioned weekly supply area.
Daily view: From the daily timeframe, we can see that three consecutive days of selling action has now taken place from the initial reaction seen at the daily Harmonic Bat reversal zone at 1.1516/1.1376. However, each time a new bearish candle prints, overall momentum seems to be diminishing. If the sellers can hang on here and continue driving this market south, it’s likely we may see price retest the daily swap area again at 1.1051-1.0918 (located just below the weekly swap level 1.1051). This, as far as we can see, would be a good place for any traders who took short positions at the daily Harmonic reversal zone to maybe lock in some profits and move stops to breakeven, as it lines up beautifully with the 0.382 retracement of A-D.
4hr view: The open 1.1197 saw the market sell off, consequently closing below a small 4hr demand area at 1.1175-1.1187. Following this, price consolidated for the rest of yesterday’s sessions between the recently broken 4hr demand zone (now supply) and the 1.1140 mark.
Although the Euro has entered into a tight phase of consolidation at the moment, we still believe price will eventually visit the round number/weekly swap ‘buy zone’ seen below at 1.1100/1.1051 (located just above the aforementioned daily swap area). With everything taken into consideration, we’ve entered into a small short position around the 1.1158 mark with a stop placed a little above 1.1200 to try and capitalize on this expected move south. Once, or indeed if, price reaches our 4hr buy zone, we’ll exit any longs we have and begin watching for lower timeframe support to hold firm and stabilize prices to potentially enter long.
Levels to watch/live orders:
- Buys: 1.1100/1.1051 [Tentative – confirmation required] (Predicative stop-loss orders seen at: 1.1037).
- Sells: 1.1158 [LIVE] (Predicative stop-loss orders seen at: 1.1205).
GBP/USD:
Weekly view: Recent events on the weekly timeframe show price has pushed above weekly supply at 1.5551-1.5391, which consequently came within a few pips of touching base with another weekly supply area seen at 1.5784-1.5620. The past month has been the most we’ve seen Cable rally since price began to sharply sell off back in mid-July 2014. Despite this, our bias will remain short on this pair until a convincing close above the weekly supply area (1.5784-1.5620) is seen.
Daily view: A strong close above the daily Quasimodo resistance line at 1.5478 was seen during yesterday’s session. As a result, price has now shook hands with a daily swap zone seen just above at 1.5619-1.5567 (positioned just below the weekly supply area mentioned above at 1.5784-1.5620).
4hr view: The open 1.5440 initially forced the pound south to retest the psychological hurdle 1.5400, which, as you can see, was clearly an area of interest to well-funded traders as price spring boarded itself northbound. This sharp ascent aggressively broke above/ retested 1.5500 as support (see clearer on the lower timeframes), and shortly after attacked the 1.5600 number.
Given that both the weekly and daily timeframes are both showing resistance (see above) at the moment, naturally our team is favoring shorts at present. With that, check out how reactive 1.5600 has been in the past, it has provided this pair significant support and resistance over the past six months or so.
Current price action has just this minute printed a 4hr bearish pin-bar candle from 1.5600, which may be all some traders need to short this market. We, however, require a little more confirmation from the lower timeframes before risking capital to this idea. Take a look at the 5 minute-timeframe insert, assuming that the 1.5581 lows hold, then we could have a potential 5 minute Harmonic bearish bat pattern forming with a reversal zone of 4 pips coming in at 1.5607/1.5603. If price reaches this small reversal zone today, we plan to short at market with a stop placed above the overall high 1.5611 (The X point to all you Harmonic traders out there) at 1.5615.
Levels to watch/ live orders:
- Buys: Flat (Predicative stop-loss orders seen at: N/A).
- Sells: 1.5600 (Predicative stop-loss orders seen at: 1.5615).
AUD/USD:
Weekly view: Following the close above the weekly swap level 0.7845, a little bearish pressure came into the market. Should this selling continue, it’s likely 0.7845 will have to prove itself as support.
Daily view: The daily picture reveals that price is currently lingering just above a minor daily demand area coming in at 0.7785-0.7850 (positioned just below the weekly swap level 0.7845).
4hr view: Sunday’s open 0.7923 saw the market immediately begin to weaken, it was only once price tested the low 0.7874 did we see any supportive pressure on this pair. Although 0.7874 has been able to hold the market higher so far, current price action does not exactly look like the bulls are in control at the moment. In fact, we would go as far to say that price will likely test Friday’s low 0.7862 seen just below very soon. Ultimately, what our team is looking for is a push below this daily low and a continued sell off down to 4hr Gartley reversal zone shaded in yellow coming in at 0.7832/0.7801. This 4hr Harmonic zone, as you can see, sits not only within a clear 4hr demand area coming in at 0.7785-0.7835, but also boasts additional round-number support seen at 0.7800.
This overall area would be a great place to look for longs into the market since let’s not forget that this 4hr area also has the backing of possible weekly support at 0.7845, and from the daily demand coming at 0.7785-0.7850.

Levels to watch/ live orders:
- Buys: 0.7832/0.7801 [Tentative – confirmation required] (Predicative stop-loss orders seen at: 0.7780).
- Sells: Flat (Predicative stop-loss orders seen at: N/A).
USD/JPY:
Weekly view: For nearly two months the weekly timeframe has shown very little change, as the buyers and sellers continue to battle for position within the weekly demand area coming in at 118.22-119.40. Our long-term bias will remain north on this pair as long as price continues to trade above the weekly swap level seen below this area at 115.50.
Daily view: From the daily scale, we can see that a clear consolidation zone has been chiseled out within the aforementioned weekly demand area between daily support seen at 118.62 (located deep within the aforementioned weekly demand area), and a daily Quasimodo resistance level coming in at 120.35. Recent movement, however, has placed price within a stone’s throw away from the upper limit of this daily range, so for any traders considering buying right now, you may want to take a note of this. It will be interesting to see what the 4hr timeframe has to say…
4hr view: The USD/JPY pair opened at 119.63, and immediately began advancing north towards 120.00. As you can see, a little selling interest was seen at this psychological level, but was clearly not enough to hold the market lower. Following this, price closed above and quickly retested this round number as support, indicating bullish strength at this point.
In the event that the buyers can continue with this bullish tempo during today’s sessions, it’s likely we’ll see prices challenge the 4hr Quasimodo resistance line coming in at 120.27. This level is not only located very near to the upper limit of the daily consolidation area at 120.35 (see daily section), but also converges nicely with a 4hr down trendline extended from the high 120.83, making it an awesome place to look for confirmed shorting opportunities if prices should trade this high. Targets would need to be kept sensible from here in our opinion, since let’s not forget that price is still hovering within weekly demand (see above) at the moment.

Levels to watch/ live orders:
- Buys: 119.00/118.62 [Tentative – confirmation required] (Predicative stop-loss orders seen at: dependent on where one confirms this area).
- Sells: 120.27/120.35 [Tentative – confirmation required] (Predicative stop-loss orders seen at: dependent on where one confirms this area).
USD/CAD:
Weekly view: From this angle, we can see that price continues to hold just above the weekly swap area coming in at 1.2034-1.1870, which as of yet has seen very little bullish interest at this zone. In the event that this area gives way, however, the path south will then likely be free for the sellers to challenge weekly demand seen at 1.1547-1.1672.
Daily view: Supportive pressure is clearly present from the daily demand area seen at 1.1931-1.2045. This should not really come as much of a surprise though, as this zone is not only located nicely within the aforementioned weekly swap area, but it also converges just beautifully with a Harmonic Bat support zone completing just below it at 1.1921. However, with all this support in the market, price has failed on two occasions to convincingly close above the mid-level number 1.1250.
4hr view: The open 1.2073 saw the bulls take immediate control, breaking above 1.2100 and attacking a 4hr downtrend line extended from the high 1.2304. As we can all see, the selling pressure at this 4hr trendline was clearly overwhelming for the buyers to contend with as the market sold off and closed back below 1.2100, which is currently holding as resistance at the time of writing. Other than this, not much has changed since our previous report.
Due to the lack of enthusiasm being seen from the buyers on the higher timeframes (see above) at the moment, our team has come to a general consensus that buying this pair will be safer once a close above the aforementioned 4hr downtrend line is seen. This, however, does not mean we cannot look for small bounce trades off of either the 4hr demand area at 1.2034-1.2048 or the large psychological number 1.2000 today. Waiting for lower timeframe confirmation is strongly advised if you’re also considering long positions from either of the above 4hr levels.
Selling this pair on the other hand, is not something our guys would be comfortable taking part in until a convincing close is seen below the 4hr demand area at 1.1931-1.1960 (located deep within the aforementioned daily demand area).

Levels to watch/live orders:
- Buys: 1.2034-1.2048 [Tentative – confirmation required] (Predicative stop-loss orders seen at: 1.2025) 1.2000 [Tentative-confirmation required] (Predicative stop-loss orders seen at: dependent on where one confirms this level).
- Sells: Flat (Predicative stop-loss orders seen at: N/A).
USD/CHF:
Weekly view: Last week’s action shows that there was an aggressive break below the weekly demand area seen at 0.9170-0.9343, which as you can see, came very near to crossing swords with the weekly swap level 0.9018. Provided that the buyers can continue with this tempo, it is possible we may see price challenge the recently broken weekly support, now resistance at 0.9512
Daily view: From the daily scale, we can see that in order for the weekly timeframe to see any further buying, price will need to take out the daily supply area coming in at 0.9411-0.9336. A break above this beauty would likely force the market to shake hands with a daily swap area seen at 0.9449-0.9545, which incidentally surrounds the weekly swap level mentioned above at 0.9512.
4hr view: The USD/CHF opened at 0.9312 which saw price eventually retest the 0.9300 handle as support. This number was clearly of interest to buyers in London, as the market saw a small rally north from here during that time, consequently closing above and retesting 4hr supply at 0.9331-0.9295.
Assuming that the buyers can hold prices above this 4hr swap area today, there may be an opportunity to buy (with lower timeframe confirming price action) up to at least 0.9400. However, let’s never forget where we are located in the higher-timeframe picture – price has just entered into the jaws of a daily supply area seen at 0.9411-0.9336. Therefore, should we find a suitable long signal around this aforementioned 4hr swap area today, our team will constantly monitor this position, and be prepared to close the trade early should active sellers make an appearance.

Levels to watch/ live orders:
- Buys: 0.9331-0.9295 [Tentative – confirmation required] (Predicative stop-loss orders seen at: N/A).
- Sells: Flat (Predicative stop-loss orders seen at: N/A).
US 30:
Weekly view: Last week’s action shows that price closed (18177) above the four-month long resistance barrier at 18098. In order for us to be convinced that this was indeed a genuine close higher, our team will need to see the buyers maintain a strong position above this number during the week.
Daily view: From this angle, we can see that price continues to range between daily support at 17850, and daily supply coming in at 18207-18117. The upper limit of this range saw downside pressure come into the market yesterday, which could, if the sellers keep the ball rolling here, test the daily trendline extended from the low 17033 sometime soon.
4hr view: (Revised) At present, the 4hr chart is a range trader’s paradise! The limits of this 4hr range (upper: 18207-18125 [located deep within the aforementioned daily supply area] lower: 17741-17850 [located just below the aforementioned daily support]) are clearly very responsive, since each time price visits one extreme, it ends with the market testing its opposing limit.
Until we see a convincing close out of this 4hr range, we intend to trade the limits each time a test is seen. However, considering that we only just saw a weekly close above a relatively important weekly level last week (see above), we’ll not be entering within this 4hr consolidation using pending orders, lower timeframe confirmation will need to accompany a test for us to risk capital on this idea.

Levels to watch/live orders:
- Buys: 17741-17850 [Tentative – confirmation required] (Predicative stop-loss orders seen at: dependent on where one confirms this area).
- Sells: 18207-18125 [Tentative – confirmation required] (Predicative stop-loss orders seen at: dependent on where one confirms this area).
XAU/USD (Gold)
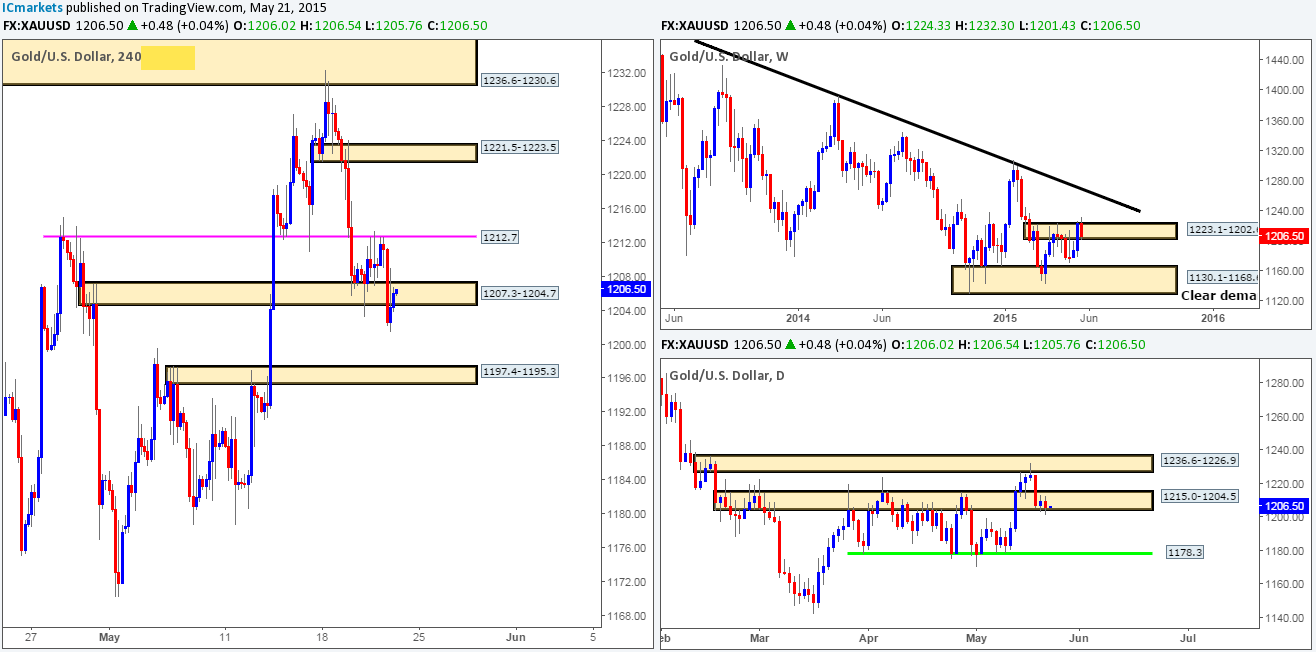
Weekly view: From a weekly standpoint, the trend on Gold is still firmly south, and will remain that way in our opinion until price closes above the weekly trendline extended from the high 1488.0. At the time of writing, however, price appears stranded in between weekly supply seen at 1223.1-1202.6 and a weekly demand area coming in at 1130.1-1168.6.
Daily view: Yesterday’s daily candle reveals that price once again tested daily support at 1178.3.This support has held firm on four occasions now, yet each time, including the most recent test seen on Thursday last week, no subsequent higher high was seen, which in itself could suggest buying weakness. A close below this daily barrier would not be the end of the world for the buyers mind you, since daily demand at 1159.4-1170.8 (located just within the aforementioned weekly demand area) lurks just below to save the day.
4hr view: The Gold market, as you can see, opened at 1188.7 and eventually sold off to test the upper limits of a small 4hr demand area seen at 1177.6-1178.6. The initial bounce seen from this 4hr zone looked to be relatively strong; the candle action that followed however was weak. This could simply be because the market is trading within a typically quiet session at the moment. Once Europe opens for business, we’ll know pretty soon whether the bulls intend to take this higher or not.
With the daily timeframe suggesting weakness is forming in the market at the moment (see above); we’re currently favoring a move lower back down to retest the aforementioned 4hr demand area. This time, we believe it will be consumed and price will attack the 4hr bullish Gartley reversal zone shaded in yellow at 1172.7/1176.5. It would be at this point that we’d begin watching for lower timeframe strength to enter the market. Should this be seen, we plan to take a long entry with a stop (depending on how price behaves) placed below the 4hr demand zone (1168.6-1170.8) at 1168.1.Take-profit targets will of course depend on how the market approaches the 4hr Harmonic reversal zone.
Levels to watch/live orders:
- Buys: 1172.7/1176.5 [Tentative – confirmation required] (Predicative stop-loss orders seen at: dependent on where one confirms this level).
- Sells: Flat (Predicative stop-loss orders seen at: N/A).
The post Tuesday 12th May: Daily technical outlook and review. appeared first on .
Source:: Tuesday 12th May: Daily technical outlook and review.