
Previous Story
Tuesday 19th August: Daily Technical Outlook and Review.
Posted On 19 Aug 2014
Comment: 0
For the readers’ benefit:
Price action confirmation: Simplymeans traders will likely wait for price action to confirm a level by consuming an opposing supply or demand area, then entering a trade on a possible retracement, this may occur on the lower timeframes also.
Pending orders: means pending orders are likely seen.
EUR/USD:
4hr TF.
The higher-timeframe picture resembles the following:
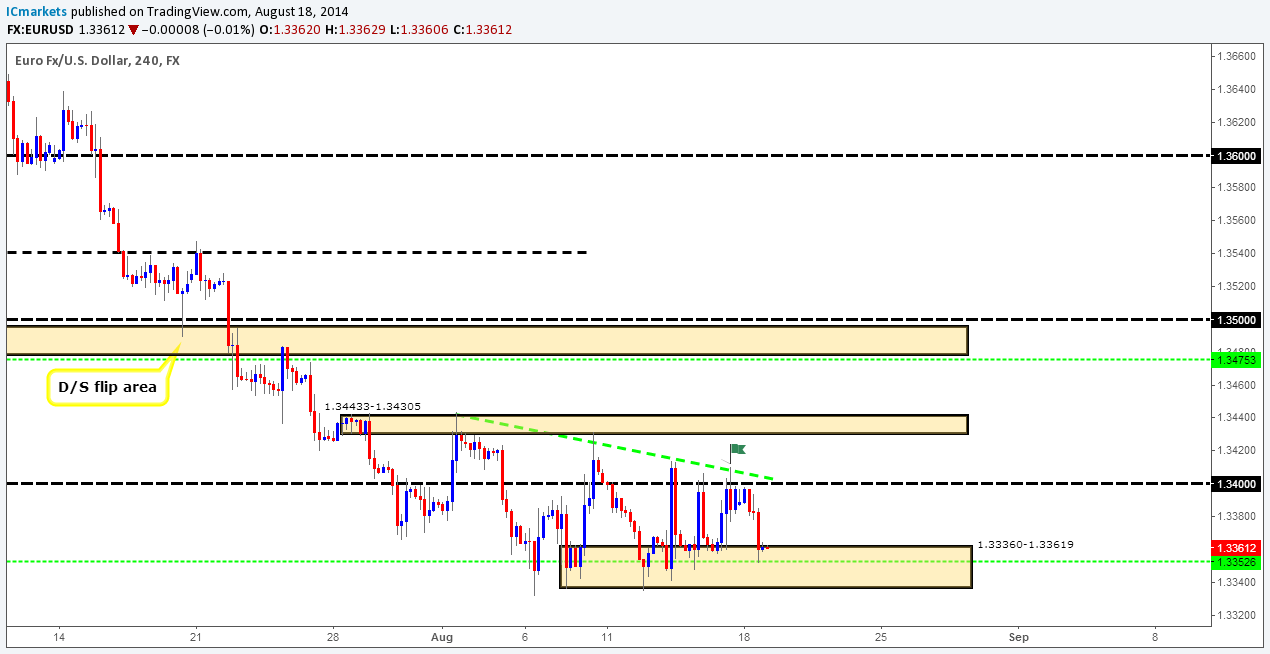
- Weekly TF: At the time of writing the sellers seem to be pushing deep within weekly demand at 1.32940-1.34847, this happened exactly the same way last week and the week before that, we thought a break below was going to happen, all of a sudden a bullish pin bar formed.
- Daily TF: Buyers and sellers still remain trading between the daily supply area above at 1.34433-1.34202 and a daily level of interest below at 1.33559. A break below could force prices down to a daily demand area at 1.31037-1.31755, conversely, a break above would likely see price hitting a daily D/S flip area at 1.34760-1.35265.
The market opened just below the round number 1.34 at 1.33879, the buyers then made a run for the round number, failed miserably, and then eventually dropped once again back down to the 4hr demand area at 1.33360-1.33619.
The price action being formed is beautiful on this pair. Take a look at the green down trend line, yes, we know this highlights the fact that price is trending south, but it also represents what pro money’s likely intentions are for the future. Notice how every time a decline was seen, price then rallied back up to collect sell orders for yet another push to the downside, however clearing out the sell orders also clears the path north for any future buying which is highly likely at the moment, as let’s not forget, price is currently trading within a weekly demand area (levels above), so higher prices are naturally expected.
For price to have any chance of rallying higher from here, a break above the high marked with a green flag will need to be seen at 1.34106, why? Well, if price breaks above this high, we have effectively entered into a zone that has very little supply/sellers left, so price would be free to travel north. If during this week sometime, we see a close above the 4hr decision-point area at 1.34433-1.34305, this will also mean not only has this area of supply been consumed, but also a daily decision-point area at 1.34433-1.34202. This means we can then likely expect higher prices at least up to the next fresh supply areas on the respective timeframes (Daily: 1.34760-1.35265, 4hr: 1.34760-1.34943).
Pending orders/P.A confirmation levels:
- The pending buy order (Green line) set within 4hr demand (1.33360-1.33619) at 1.33526 is now active, Our first take-profit level was hit at 1.34, so do keep an eye on our second and final take-profit level set at 1.34305.
- No P.A confirmation buy levels (Red line) are seen in the current market environment.
- Pending sell orders (Green line) are seen just below the 4hr D/S flip area (1.34760-1.34943) at 1.34753.The reasoning behind setting a pending sell order here was because this is the area we believe on this timeframe pro money sellers made the decision to push prices south into (what was at the time) 4hr demand at 1.33984-1.34404, with the possibility of unfilled sell orders still waiting there.
- No P.A confirmation sell levels (Red line) are seen in the current market environment.
Quick Recap:
What we’re currently looking at on the 4hr timeframe is a break above the high marked with a green flag at 1.34106, when, or indeed if price does break above here, we can likely expect a rally up to at least the 4hr decision-point area at 1.34433-1.34305.
- Areas to watch for buy orders: P.O: 1.33526 (Active) (SL: 1.33280 TP: [1] 1.34 [2] 1.34305).P.A.C: No P.A confirmation buy levels are seen in the current market environment.
- Areas to watch for sell orders: P.O: 1.34753 (SL: 1.35031 TP: Dependent on price approach).P.A.C: No P.A confirmation sell levels are seen in the current market environment.
GBP/USD:
4hr TF.
The higher-timeframe picture resembles the following:
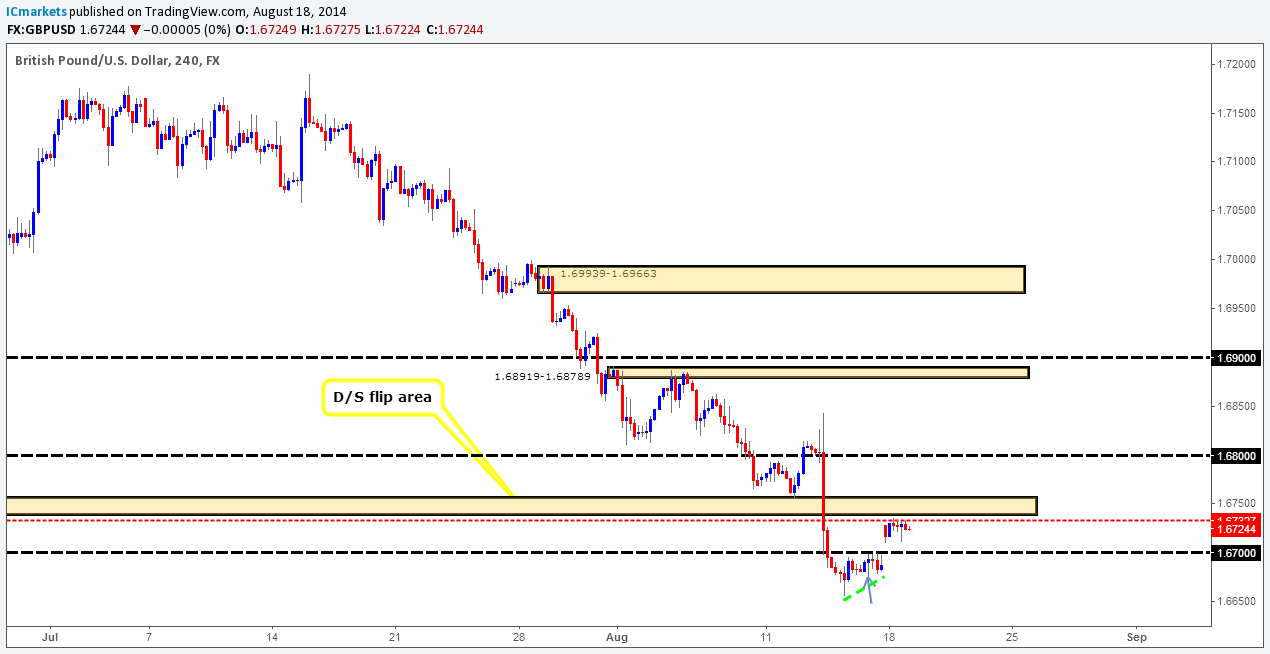
- Weekly TF: Over the past few weeks, serious selling has been seen from the weekly supply area at 1.76297-1.67702, which consequently saw price closing below a weekly demand area last week at 1.66917-1.67935. The path south is now likely free to trade lower down to around weekly demand at 1.64589-1.66339.
- Daily TF: A retest is now being seen of the daily D/S flip area at 1.67367-1.68440; this retest could very well be all the sellers need to push down into daily demand at 1.65492-1.66044, which would consequently bring prices into the weekly demand area mentioned above.
Whoa! Weekend trading has seen the pound jump up in value above the round number 1.67, with the market opening above Friday’s close (1.66876) at 1.67291.
This appreciation in value has forced prices to hit active sell orders around the 4hr D/S flip area at 1.67389-1.67561 (conveniently located within a daily D/S flip area at 1.67367-1.68440) where price is currently seen consolidating below at the time of writing. If the sellers do intend on bringing price south from here, the first trouble area on the horizon is likely going to be the round number 1.67, as a lot of traders will be looking to play the retest north, which will consequently close the weekend gap, so a close below here is what we’re ideally looking for.
Pending orders/P.A confirmation levels:
- No pending buy orders (Green line) are seen in the current market environment.
- No P.A confirmation buy levels (Red line) are seen in the current market environment.
- No pending sell orders (Green line) are seen in the current market environment.
- The P.A confirmation sell level (Red line) set just below the round number 1.67 at 1.66961 has now been removed since price traded too far above the entry level for the time being.
- The P.A confirmation sell level (Red line) set just below the 4hr D/S flip area (1.67389-1.67561) at 1.67327 is now active and awaiting confirmation. For this area to be confirmed we would like to see the sellers break price below the low marked with an arrow at 1.66757, only then will we consider setting a pending sell order in the market.
Quick Recap:
Our P.A confirmation sell level (1.67327) has been triggered, which is set just below the 4hr D/S flip area at 1.67389-1.67561 (conveniently located within a daily D/S flip area at 1.67367-1.68440). The first trouble area we see on the horizon is around the round number 1.67; a close below here could likely seal the deal for lower prices.
- Areas to watch for buy orders: P.O: No pending buy orders are seen in the current market environment. P.A.C: No P.A confirmation buy levels are seen in the current market environment.
- Areas to watch for sell orders: P.O: No pending sell orders are seen in the current market environment. P.A.C: 1.67327 (Active-awaiting confirmation) (SL: Dependent on price action after the level has been confirmed TP: Dependent on approaching price action after the level has been confirmed).
AUD/USD:
4hr TF.
The higher-timeframe picture resembles the following:
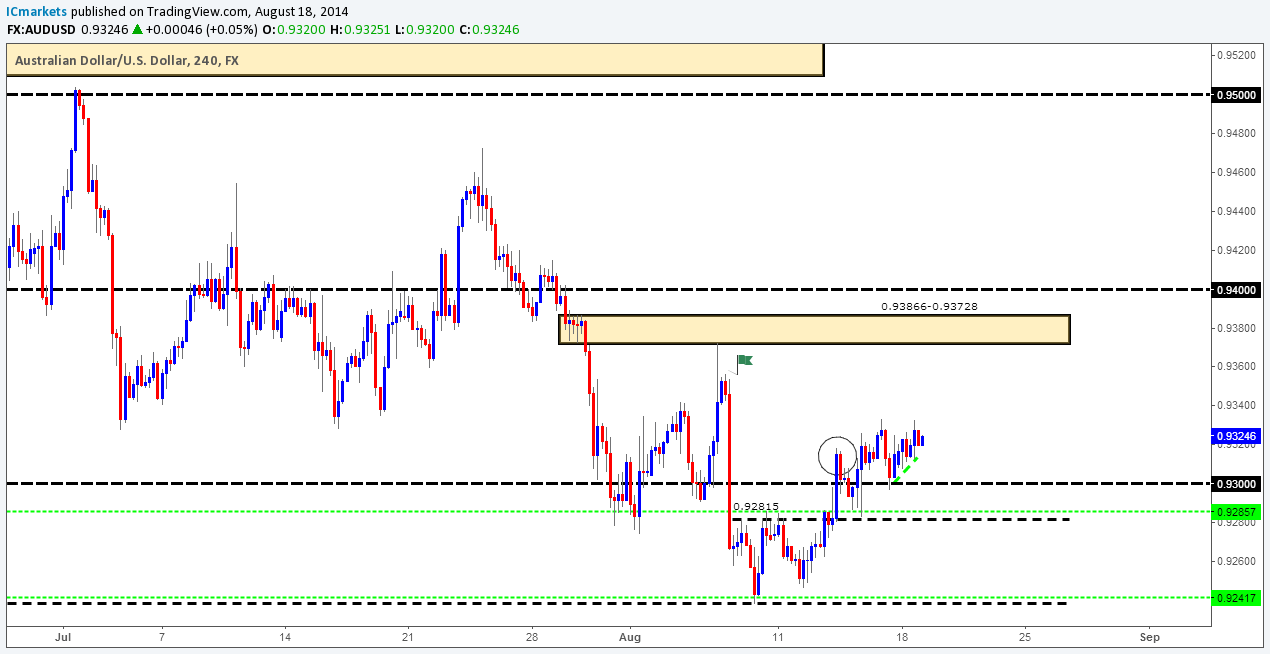
- Weekly TF: Price is still frustratingly trading within a weekly consolidation area with the upper limits seen at 0.94600, and the lower at 0.92046, with no signs of a break happening just yet.
- Daily TF: Price still remains caught trading between the daily demand area 0.92046-0.92354, and a daily decision-point level at 0.93529. A break above could see prices test daily supply at 0.94729-0.94175, conversely, a break below will likely see a push south towards a daily R/S flip level at 0.91323. Let’s also not forget, if a break below is indeed seen, this would effectively mean that price has broken below the weekly consolidation area (levels above) as well.
The market opened at 0.93103, and the overall direction so far has been north. One thing to mention before continuing is the green trendline, most who follow us will know what it means already by now, but for those new, all it likely means is pro money are consuming small demand pockets as price is rallying, thus clearing the path south for the sellers.
For the time being, active sell orders around a 4hr minor supply area at 0.93226-0.93333 seem to be keeping price from rallying. If we see a close above this 4hr supply area, we can likely expect price to at least trade to the level of 4hr supply marked with a green flag at 0.93529 (prominent daily decision-point level – take a look on the daily chart), which is the only level stopping price from hitting our third and final take-profit target at 0.93728 (active long position from 0.92417). However, if we see a push/spike below the round number down to the 4hr R/S flip level at 0.92815, this would likely fill our pending buy order set just above at 0.92857, and allow pro money to collect more liquidity to push higher (traders who are already long from the round number, their stops will be either just below or set at breakeven by now, once these stops are triggered, they become sell orders = liquidity for pro money to buy into. Also, there will be a lot of breakout sellers selling if a close below is seen, thus handing over more sell orders to pro money).
So, for the time being it is a waiting game for us on this pair!
Pending/P.A confirmation levels:
- The pending buy order (Green line) set just above the 4hr decision-point level (0.92384) at 0.92417 is now active. Our second take-profit target has recently been hit at 0.93, so do keep an eye out for our third and final take-profit target set at 0.93728.
- Pending buy orders (Green line) are seen just above a minor 4hr R/S flip level (0.92815) at 0.92857. The reasoning behind setting a pending buy order here is simply because the buyers pushed off nicely from this level, and consumed what appears to be most of the sellers around the high marked with a circle at 0.93185 possibly clearing the path north, so if price does indeed return to this area, a first-time reaction is very much expected.
- No P.A confirmation buy levels (Red line) are seen in the current environment.
- No pending sell orders (Green line) are seen in the current environment.
- No P.A confirmation sell levels (Red line) are seen in the current market environment.
Quick Recap:
we expect one of two things to happen, a break above 0.93333, which will likely push prices up to the area of supply marked with a green flag at 0.93529 (daily decision-point level at 0.93529), which is the only level stopping price from hitting our third and final take-profit target at 0.93728 (active long position from 0.92417), nonetheless, price could see a push down to the round number 0.93, or with enough effort from the sellers a break below to a 4hr S/R flip level at 0.92815 (filling our pending buy order set at 0.92857 in the process) before higher prices are seen.
- Areas to watch for buy orders: P.O: 0.92417 (Active) (SL: 0.92228 TP: [1] 0.92815 [2] 0.93 [3] 0.93728) 0.92857 (SL: 0.92700 TP: Dependent on how price approaches the area). P.A.C: No P.A confirmation buy levels seen in the current market environment.
- Areas to watch for sell orders: P.O: No pending sell orders seen in the current market environment. P.A.C: No P.A confirmation sell levels seen in the current market environment.
USD/JPY:
4hr TF.
The higher-timeframe picture resembles the following:
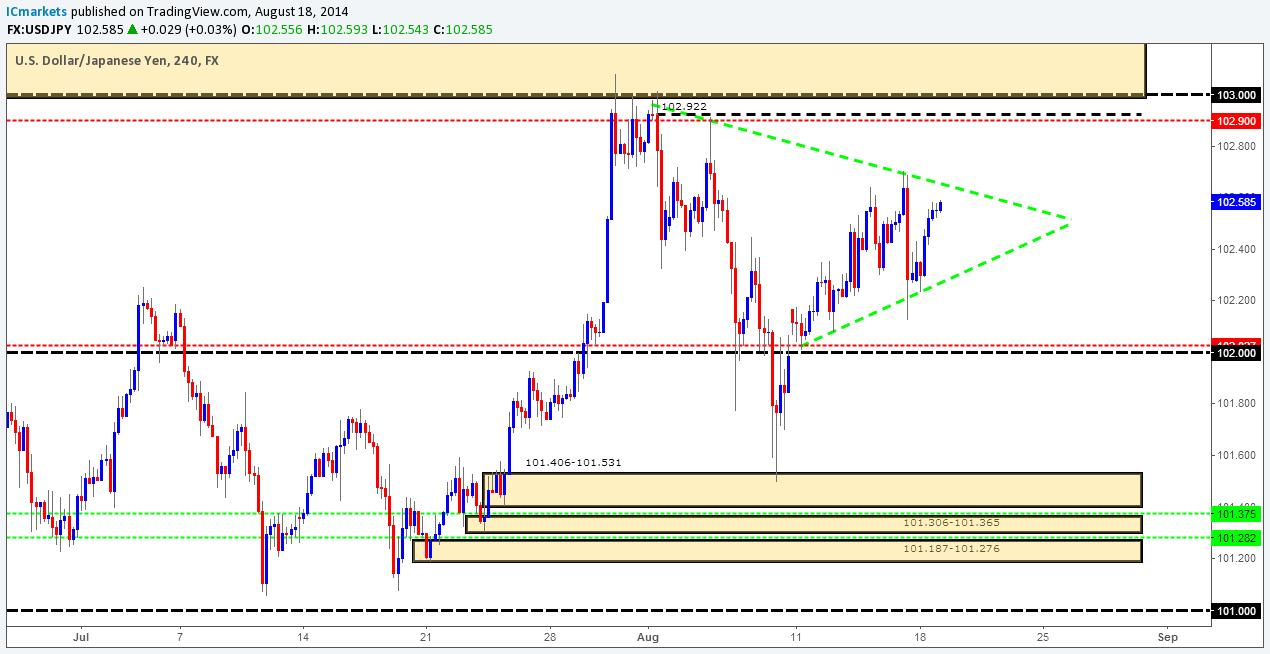
- Weekly TF: price still remains trading between a long-term weekly R/S flip level at 101.206, and a weekly supply area above at 105.432-104.065.
- Daily TF: Buying pressure is currently being seen around the daily resistance level at 102.713, a break above here could happen soon since most of the sellers are likely already consumed by those three prominent spikes/wicks (103.082).
Price action on the 4hr timeframe is currently a mess in our opinion, we have no clear direction, as price seems to be compressing within a triangle formation (green lines), and this is certainly not something we would consider trading at the moment.
We are watching to price to break out north from here because of where we are currently located on the higher timeframes. Extra buying pressure will likely coming off of the weekly R/S flip level support at 101.206; meanwhile the daily resistance level at 102.713 appears set to break. We have set a P.A confirmation sell level (102.900) just below a 4hr decision- point level at 102.922 as this could be where price will trade to if we do indeed see a breakout north. However, we have learnt to expect the unexpected in these markets, a break below out of the triangle could see prices trading down to the round number 102, where we also have a P.A confirmation buy level waiting at 102.027. It will be interesting to see how this all unfolds!
Pending/P.A confirmation levels:
- Pending buy orders (Green line) are seen just above the 4hr demand area (101.187-101.276) at 101.282. A pending buy order has been placed here simply because we are trading relatively close to daily demand at 100.747-100.967 and also this 4hr area remains fresh and untouched for the time being.
- Pending buy orders (Green line) are seen just above the 4hr demand area (101.306-101.365) at 101.375. A pending buy order has been placed here simply because we are trading relatively close to daily demand at 100.747-100.967 and also this 4hr area remains fresh and untouched for the time being.
- P.A confirmation buy levels (Red line) are seen just above the round number 102 at 102.027. The reason behind setting a P.A confirmation buy level here, and not a pending buy order is simply because as explained many times over, these round number levels are sometimes subject to deep test/spikes, which consequently stops out countless traders, we do not want to be one of them, hence the need for confirmation here.
- No pending sell orders (Green line) are seen in the current market environment.
- P.A confirmation sell levels (Red line) are seen just below a 4hr decision-point level (102.922) at 102.900. The reason for setting a P.A confirmation sell level here is simply because price has already tested this area, meaning that supply could have already been consumed, hence the need to wait for confirmation.
Quick Recap:
We are currently watching for a breakout north of the triangle formation towards the 4hr decision-point level at 102.922 (a P.A confirmation sell level is set just below at 102.900). Nonetheless, we are also prepared for a breakout south trading down to the round number 102, where we also have a P.A confirmation buy level waiting at 102.027, so do keep an eye on these levels!
- Areas to watch for buy orders: P.O: 101.282 (SL: 101.158 TP: Dependent on price approach) 101.375 (SL: 101.158 TP: Dependent on price approach). P.A.C: 102.027 (SL: Dependent on price action after the level has been confirmed TP: Dependent on approaching price action after the level has been confirmed).
- Areas to watch for sell orders: P.O: No pending sell orders are seen in the current market environment. P.A.C: 102.900 (SL: Dependent on price action after the level has been confirmed TP: Dependent on approaching price action after the level has been confirmed).
EUR/GBP:
4hr TF
The higher-timeframe picture resembles the following:
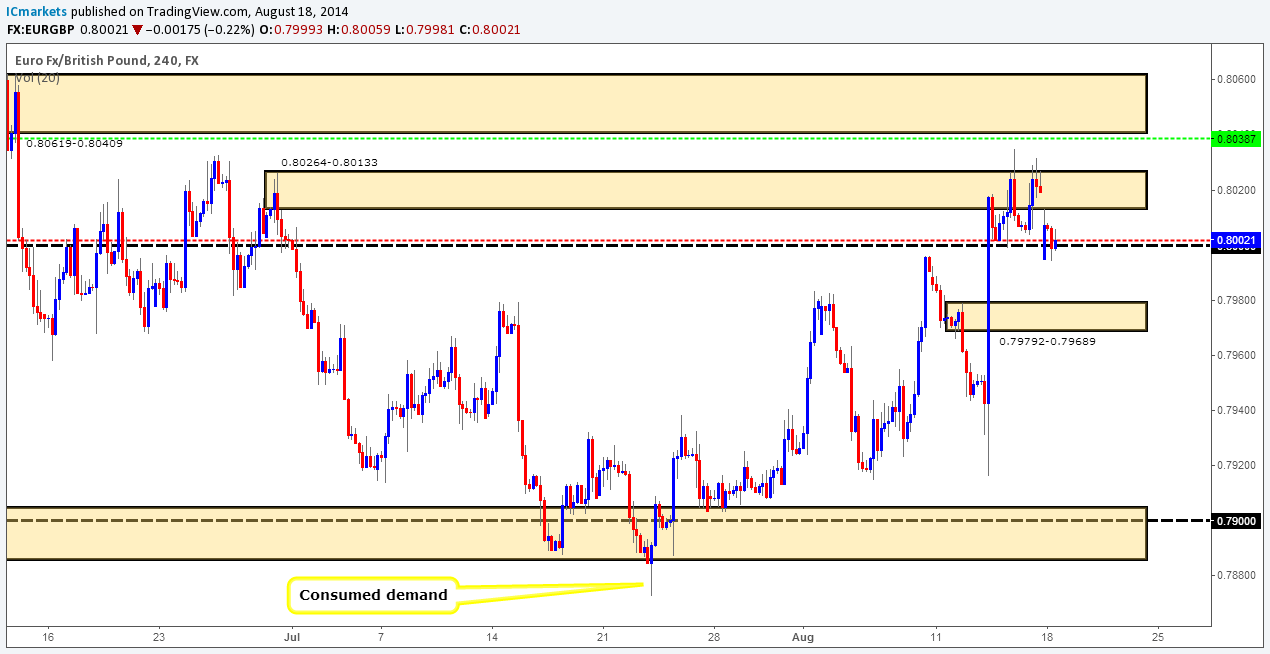
- Weekly TF: A small spike above the weekly decision-point area has been seen at 0.80328-0.79780, this spike above has likely cleared some of the sellers out indicating the path north to around weekly supply above at 0.81397-0.80805 is relatively free.
- Daily TF: A spike (0.80351) above daily supply at 0.80328-0.80024 has been seen, this spike has likely stopped out a lot of sellers attempting to fade the area. With these sellers consumed, price is very likely free to move up to the next area of interest around a daily S/R flip level at 0.80809. However, before this happens, do be prepared for decline in value back down to daily demand at 0.78862-0.79206 at least, since pro money may not have the required liquidity (sell orders for their buys) for a push further up just yet.
The market opened relatively low compared to Friday’s close (0.80196) at 0.79952 just below the big figure number 0.8 where price has overall remained trading up to now.
Since price has traded quite deeply below the aforementioned round number it is very likely that some, or indeed most of the buyers are now filled. What this also means is if there are not enough buy orders around this area, which for the moment looks to be this way, we could see a sharp decline down to the 4hr S/D flip area at 0.79792-0.79689 where active unfilled buy orders are possibly present.
So, as was mentioned in the last analysis, most of the sellers are consumed around the 4hr supply area above at 0.80264-0.80133, which means price is likely free to hit 4hr supply above at 0.80619-0.80409. however, for pro money to make this happen, they need sell orders to buy into (the sellers’ stops from around 4hr supply at 0.80264-0.80133 are now buy orders, pro money cannot use them to buy into! A decline in value may well be seen to entice more sell orders into the market for pro money to use as liquidity, the areas we are watching closely for price to decline to are the round number 0.8 which is where price is currently trading at now, and the 4hr S/D flip area below at 0.79792-0.79689.
Pending/P.A confirmation levels:
- No pending buy orders (Green line) are seen in the current market environment.
- The P.A confirmation buy level (Red line) set just above the round number 0.8 at 0.80017 is now active and awaiting confirmation. For this level to be confirmed, buyers must close the gap above, we would then consider setting a pending buy order.
- Pending sell orders (Green line) are seen just below 4hr supply (0.80619-0.80409) at 0.80387. The reasoning for placing a pending sell order here is simply because the momentum from the supply base was very good, and this area remains fresh.
- No P.A confirmation sell levels (Red line) are seen in the current market environment.
Quick Recap:
Our P.A confirmation buy level (0.80017) has been triggered, and is currently waiting to be confirmed. However, it appears price has traded quite a way below the round number 0.8, which has likely filled a lot of buyers in the process, which likely means price could theoretically drop down hard to the 4hr S/D flip area at 0.79792-0.79689.
- Areas to watch for buy orders: P.O: No pending buy orders are seen in the current market environment.P.A.C: 0.80017(Active-awaiting confirmation) (SL: Dependent on price action after the level has been confirmed TP: Dependent on approaching price action after the level has been confirmed).
- Areas to watch for sell orders: P.O: 0.80387 (SL: 0.80648 TP: Dependent on how price approaches) P.A.C: No P.A confirmation sell levels are seen in the current market environment.
USD/CAD:
The higher-timeframe picture resembles the following:
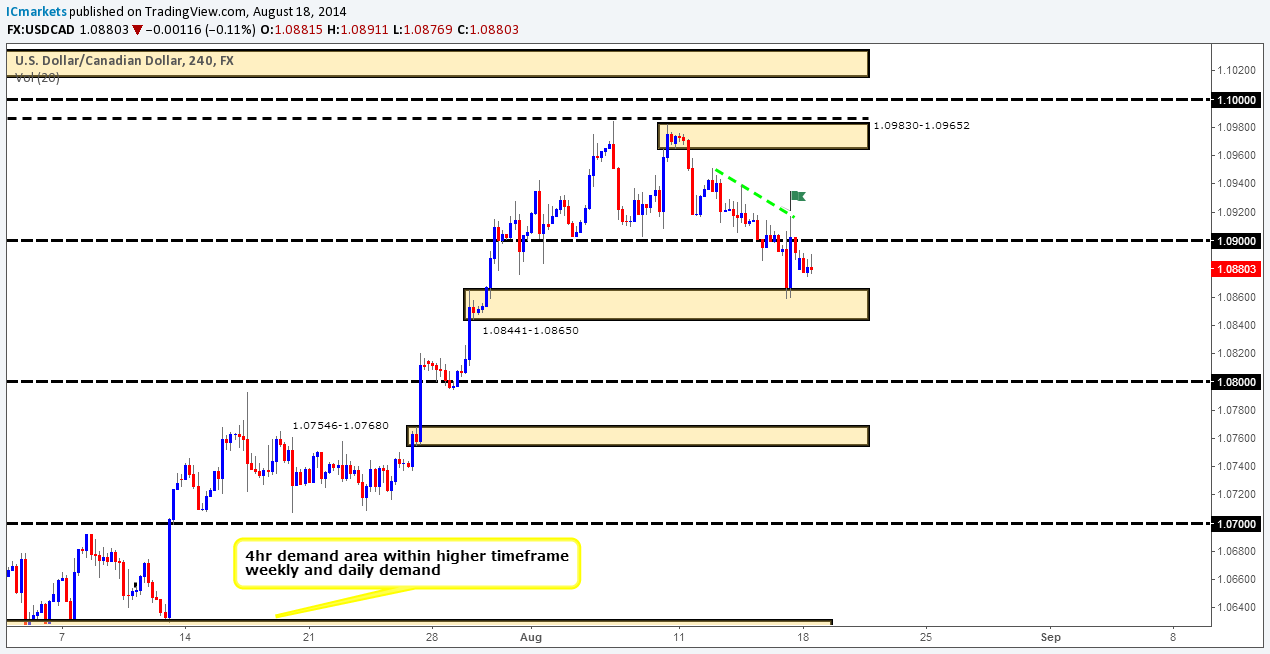
- Weekly TF: Upon price closing above the weekly supply area at 1.09592-1.08133, the path north is relatively free to hit the small weekly supply area above at 1.10522-1.09996, however before this happens a decline in value may well be seen all the way back down to weekly demand at 1.05715-1.07008, since pro money may need more liquidity (sells for their buys) for a further push up.
- Daily TF: A mini tug of war was being seen around daily supply at 1.09592-1.09156 which very likely cleared the sellers out, leaving the path relatively clear up to the daily supply above at 1.10522-1.10133 (located within the weekly supply area at 1.10522-1.09996). Pro money may not have the liquidity to push prices further yet, so a decline (which seems to have already started) may be seen down to the following levels: daily S/R flip level at 1.08277, a daily minor R/S flip level at 1.07932, or even the daily demand area at 1.05874-1.06680 which is conveniently located within weekly demand at 1.05715-1.07008.
A small decline in value was seen on this pair as price opened lower than Friday’s close (1.08919) at 1.08800, and has not moved much since, as such our original analysis remains the same:
The green trendline has been placed on the chart not to represent a trend as such, it is more to show how pro money have likely consumed the sellers as price was dropping, thus clearing the path north. So, with this in mind we see a possible trade if a break above the high marked with a green flag is seen at 1.09179, we could then see a quick decline back to the 4hr demand area at 1.08441-1.08650 (which is where we’ll be looking for longs), for a further push up to at least 4hr supply at 1.09830-1.09652.
However since the higher-timeframe picture indicates price could very well drop a lot further, a break below the aforementioned 4hr demand area might be seen, and as such, a test of the round number 1.08 is to be expected. So, unfortunately for now on this pair, it is a waiting game.
Pending/P.A confirmation levels:
- No pending buy orders (Green line) are seen in the current market environment
- No P.A confirmation buy levels (Red line) are seen in the current market environment.
- The pending sell order (Green line) set just below 4hr supply (1.10388-1.10163) at 1.10133 has been removed for the time being since price has dropped too far from the entry level.
- No P.A confirmation sell levels (Red line) are seen in the current market environment.
Quick Recap:
What we’re currently watching is for price to break above the high marked with a green flag at 1.09179, and then see if price declines down to around the 4hr demand area at 1.08441-1.08650 (where we’ll be looking to enter long), for a further push up to at least 4hr supply at 1.09830-1.09652. However, we are fully prepared for a break below the aforementioned 4hr demand area, which could likely force price down to the round number 1.08.
- Areas to watch for buy orders: P.O: No pending buy orders are seen in the current market environment. P.A.C:No P.A confirmation buy levels seen within the current market environment.
- Areas to watch for sell orders: P.O: No pending sell orders are seen in the current market environment. P.A.C: No P.A confirmation sell levels seen within the current market environment.
USD/CHF:
4hr TF.
The higher-timeframe picture resembles the following:
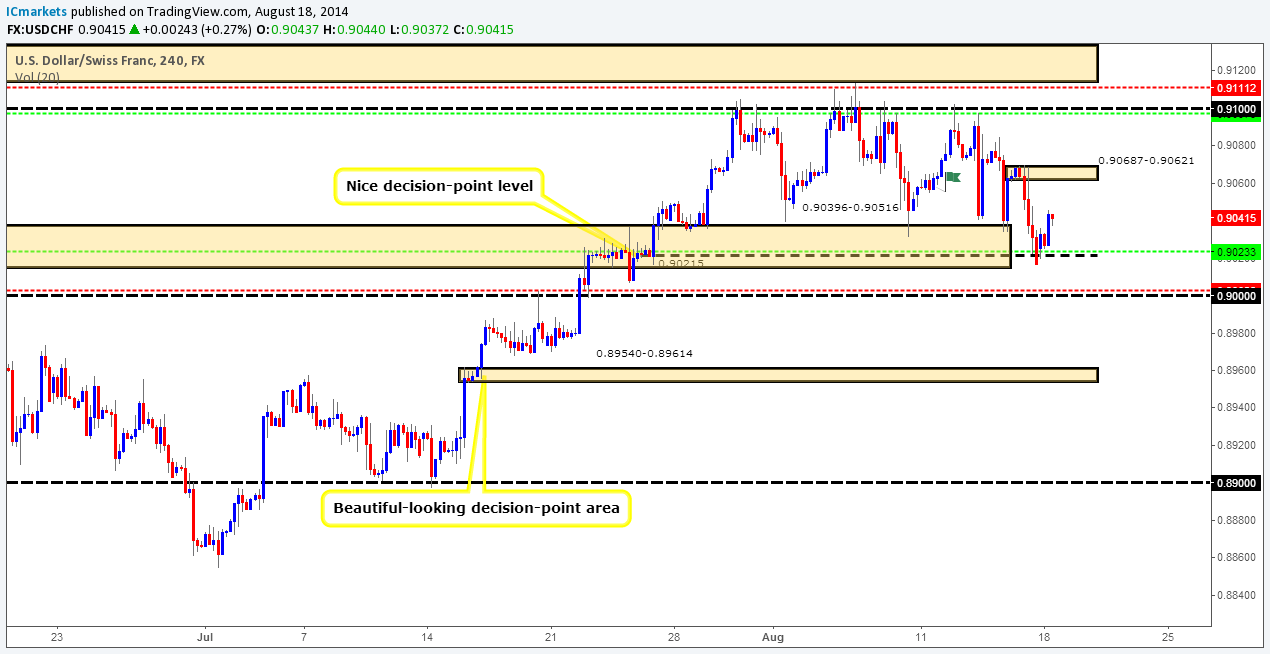
- Weekly TF: Price is still seen dancing around the weekly decision-point level at 0.90927 and has been for three weeks now. A push south could see a touch of weekly demand at 0.85664-0.88124, likewise a push above could see price testing weekly supply at 0.94546-0.93081.
- Daily TF: At the time of writing, price is still trading within a daily range. Daily supply is seen above at 0.91556-0.90985 and a daily S/D flip area below at 0.90372-0.90042 with price for the time being trading around the lower limits of this daily range.
Our active long position (0.90233) set just above the 4hr decision-point level at 0.90215 seems to be doing well for the moment. The market opened a little higher than Friday’s close (0.90172) at 0.90258, and has largely remained bullish. We see very little to the left stopping price on the 4hr timeframe from reaching the first take-profit level set at 0.90621.
However, traders who took the same long position would be wise to watch price action carefully, since we are still trading around a weekly decision-point level at 0.90927 meaning a bearish reversal could be seen at any moment. The thing we have supporting this trade is we are currently trading around daily demand at 0.90372-0.90042, but as most already know, higher timeframes usually overrule the lower!
Pending/P.A confirmation levels:
- The pending buy order (Green line) set just above the decision-point level (0.90215) at 0.90233 is now active, so do keep an eye on our first take-profit target set at 0.90621.
- P.A confirmation buy levels (Red line) are seen just above the round number 0.9 at 0.90026. The reasoning behind not placing a pending buy order right away is simply because this level could see a deep test, or even worse, be completely ignored!
- P.A confirmation sell levels (Red line) are seen just below 4hr supply (0.91329-0.91141) at 0.91112. The reasoning behind setting a P.A confirmation sell order here is because price has already visited this area once already, this likely means some of the sellers have already been consumed, so a push higher may well be seen into the 4hr supply area, or even a break above, hence the need for confirmation here.
- Pending sell orders (Green line) are seen just below the round number 0.91 at 0.90975. Our reasoning behind setting a pending sell order here is because the sellers previously consumed most of the buyers around the low marked with a green flag at 0.90553, likely indicating the path south is clear, thus we have now placed a pending sell order awaiting a possible return.
Quick Recap:
Our active buy order seems to be in good shape for the time being, we are targeting the 4hr supply above at 0.90687-0.90621. Regarding this long position, we are well aware price is still trading around a weekly decision-point level at 0.90927 meaning a bearish reversal could be seen at any moment. The thing we have supporting this trade is we are currently trading around daily demand at 0.90372-0.90042, so it will be interesting to see how price action unfolds.
- Areas to watch for buy orders: P.O: 0.90233 (Active) (SL: 0.90117 TP: 0.90621 – May be subject to change). P.A.C: 0.90026 (SL: Dependent on price action after the level has been confirmed TP: Dependent on approaching price action after the level has been confirmed).
- Areas to watch for sell orders: P.O: 0.90975 (SL: 0.91355 TP: Dependent on how price approaches) P.A.C: 0.91112 (SL: Dependent on price action after the level has been confirmed TP: Dependent on approaching price action after the level has been confirmed).
XAU/USD (Gold):
4hr TF.
The higher-timeframe picture resembles the following:
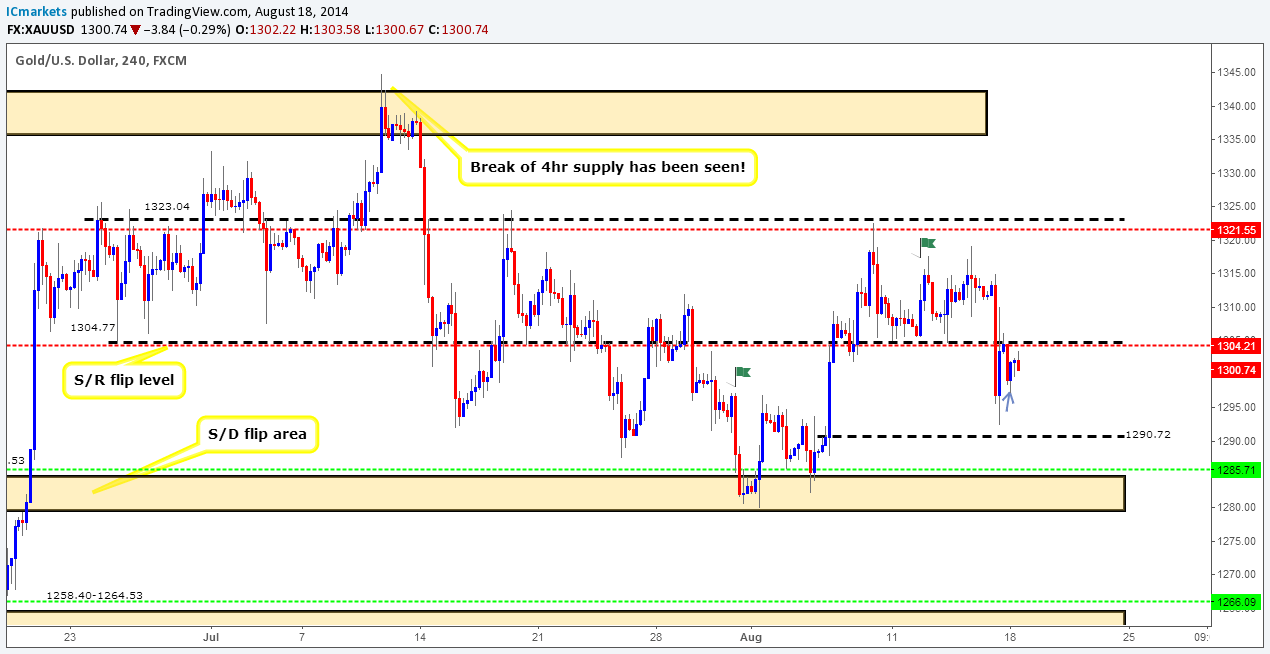
- Weekly TF: Price still remains trading between the weekly supply area above at 1391.97-1328.04 and a nice-looking weekly decision-point level below at 1244.04; however, current trading action is taking place nearer the weekly supply area for the time being.
- Daily TF: Price is capped between the aforementioned daily S/R flip level and a daily decision-point level at 1318.96. If a break above is seen, watch for price to likely test daily supply at 1344.91-1333.55, conversely, a break below could see a drop in price down to a major daily S/R flip level at 1277.36.
The market opened at 1304.58, just below the 4hr S/R flip level at 1304.77, and the sellers immediately got to work! However it did not take the buyers too long to put a stop to this and push prices back up to around the aforementioned 4hr S/R flip area.
We see a short-term opportunity on gold; it may not work, and will definitely require confirmation. A break below the 4hr S/R flip level (level above) was seen last week, as was a minor retest, take a look below there, can you see the decision candle marked at 1290.72? This took a lot of buying power to move price, the only people who can move price this much is pro money, and a touch of this level is yet to be seen and would make a fantastic target. So, we have placed a P.A confirmation sell level at 1304.21 just under the 4hr S/R flip level, for us to place a pending sell order here we want to see the buyers around the low marked with an arrow at 1297.23 consumed, price may then see a small retracement, fill our pending sell order (which will be set if the buyers are consumed around the low), and then drop down to the 4hr decision-point level/candle mentioned above.
Pending/P.A confirmation levels:
- Pending buy orders (Green line) are seen just above 4hr demand (1258.40-1264.53) at 1266.09. The reason a pending buy order has been set here, is because this area in our opinion remains the overall origin of a big rally to the upside, likely meaning there are a lot of unfilled buy orders siting in and around this area.
- Pending buy orders (Green line) are seen just above the 4hr S/D flip area (1284.77-1280.53) at 1285.71. We have set a pending buy order here since the buyers have proved this to be an area of interest (they traded above the high marked with a green flag at 1297.20 – which was at the time a requirement for a pending buy order to be set), so for the time being we are now awaiting a return back to this area where our pending buy order will likely be filled in the process.
- No P.A confirmation buy levels (Red line) are seen in the current market environment.
- No pending sell orders (Green line) are seen in the current market environment.
- P.A confirmation sell levels (Red line) are seen just below the 4hr R/S flip level (1323.04) at 1321.55. We have set a P.A confirmation sell level here simply because price could easily break above this level, and head for the 4hr supply area at 1342.30-1335.74, hence the need to wait for confirmation.
- The P.A confirmation sell level (Red line) set just below the 4hr S/R flip level (1304.77) at 1304.21 is now active and awaiting confirmation. For this area to be confirmed, the sellers will need to consume some or most of the buyers around the low marked with an arrow at 1297.23, we will then consider setting a pending sell order awaiting a possible return.
Quick Recap:
A P.A confirmation sell order has been set just below the 4hr S/R flip level (1304.77) at 1304.21, we need to the low below marked with an arrow at 1297.23 to be consumed before we consider setting a pending sell order. Our idea is that price has not hit the overall decision-point candle at 1290.72, and we believe a decline south will be seen if price successfully retests the aforementioned 4hr S/R flip level.
- Areas to watch for buy orders: P.O: 1266.09 (SL: 1256.40 TP: Dependent on price approach) 1285.71 (SL: 1278.53 (TP: Dependent on price approach). P.A.C: No P.A confirmation levels are seen in the current market environment.
- Areas to watch for sell orders: P.O: No pending sells orders seen in the current market environment. P.A.C: 1321.55 (SL: Dependent on price action after the level has been confirmed TP: Dependent on approaching price action after the level has been confirmed) 1304.21 (SL: (SL: Dependent on price action after the level has been confirmed TP: Dependent on approaching price action after the level has been confirmed).


