
Previous Story
Tuesday 23rd December: Daily technical outlook and review (Japan – Bank holiday today)
Posted On 22 Dec 2014
Comment: 0
Caution is advised for anyone trading this week, as low liquidity is expected during the Christmas and New Year festive season.
EUR/USD:
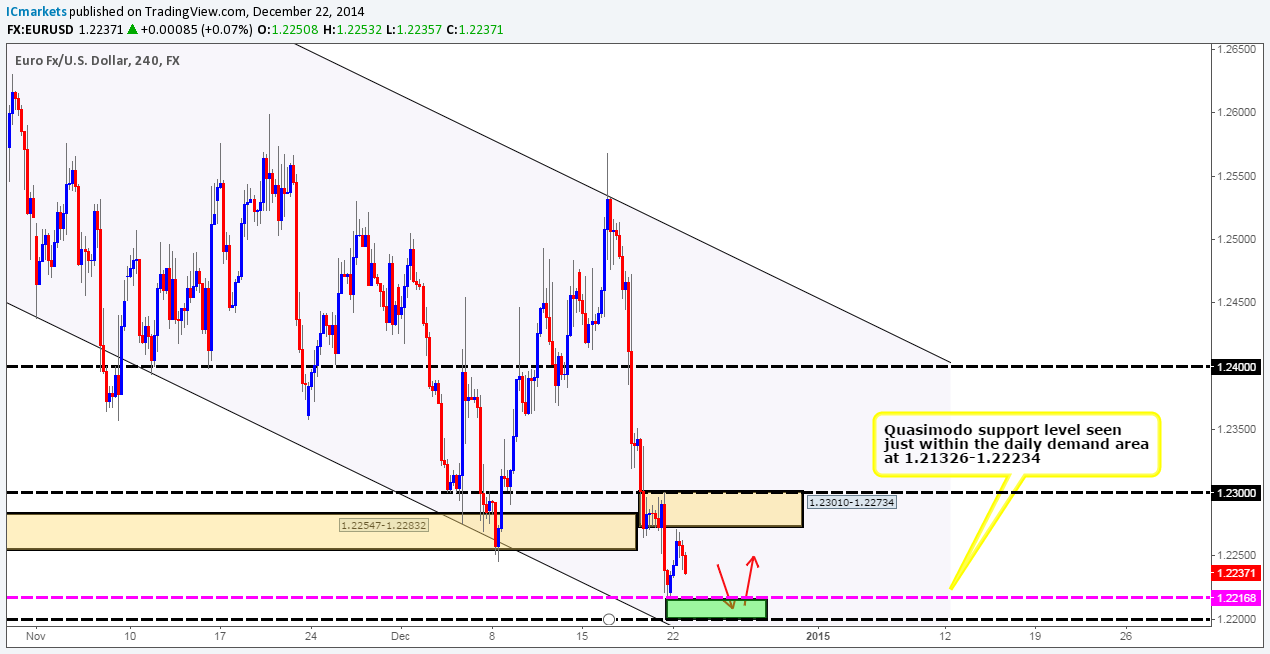
Weekly Timeframe: Last week saw the market close below a weekly Quasimodo support area at 1.22403-1.22942. Assuming that this move took out the majority of sellers here, we could potentially see further selling down to a partially consumed weekly demand area coming in at 1.18754-1.20958 sometime this week. It will be interesting to see what the lower timeframes have to say about this.
Daily Timeframe: The daily timeframe on the other hand shows that just below the aforementioned weekly Quasimodo support area, price is currently dancing around the upper limits of a long-term daily demand area seen at 1.21326-1.22234, where active buyers could indeed be waiting.
4hr Timeframe: It was mentioned in Monday’s analysis that we would be looking for lower-timeframe buy signals between a 4hr Quasimodo support level seen at 1.22168 and the round-number 1.22 (green area), and that our first take-profit target would be the 4hr supply area seen above at 1.23010-1.22734. As we can all see, the market did indeed rally higher, but unfortunately did not hit 1.22168 beforehand so we missed this move entirely. All is not lost though; we still feel there is a good chance that higher prices may still be seen from this green area, if/when price returns here, and as such, we’re still open to the possibility of buying here in the near future.
The reason we believe higher prices are still possible from here is simply because along with the daily demand area mentioned above at 1.21326-1.22234, the aforementioned 4hr Quasimodo level and round-number 1.22, we see extra support coming in from a 4hr downtrend channel line (limits can be found at: 1.27696-29/10/14 – 1.24378-02/11/14.
With combined support being seen from the daily and 4hr timeframes (see above) at the moment (see above), it certainly smells like a fakeout is boiling just below the aforementioned weekly Quasimodo support area. Only time will tell though.
Current buy/sell levels:
- Buy orders: Will watch for lower-timeframe buy entries between 1.22168/1.22 (Predicative stop-loss orders seen at: dependent on where one confirms the level).
- Sell orders: Flat (Predicative stop-loss orders seen at: N/A).
GBP/USD:
Weekly Timeframe: The GBP/USD is still seen trading between a nice-looking weekly demand area at 1.54260-1.56110, and a weekly swap level seen at 1.57166. A break above may see the buyers push higher towards 1.58934, another weekly swap level. And conversely, a break lower would likely attract further selling down towards a major weekly swap level coming in at 1.52700.
Daily Timeframe: The pound appears to be going nowhere in a hurry according to the daily timeframe. Since the 08/12/14, price has been sandwiched between the weekly swap level mentioned above at 1.57166, and a daily demand area seen at 1.54260-1.55378 (located relatively deep within the aforementioned weekly demand area). Let’s take a look on the 4hr timeframe to see what we can find.
4hr Timeframe: The buying interest seen around the open (1.56202) was consequently brought to a halt a few candles later when active sellers entered the market around 1.56642 forcing the pound to trade lower.
At the time of writing, price is currently trading below 1.56. In the event price closes below here, this would likely entice further selling down towards a 4hr support area coming in at 1.55402-1.55627 (located just above the aforementioned daily demand area). Assuming the above takes place, we will be watching the lower timeframes for a confirmed buy signal around the 1.55653 mark. With that being said, since we are so near to Christmas Eve, and liquidity will very likely be low, we only intend to trade this level for a quick scalp/bounce up to 1.56 (as per the red arrows), as holding positions over the Christmas period is something we are not comfortable doing.
Current buy/sell levels:
- Buy orders: 1.55653 [Tentative] (Predicative stop-loss orders seen at: 1.55374).
- Sell orders: Flat (Predicative stop-loss orders seen at: N/A).
AUD/USD:
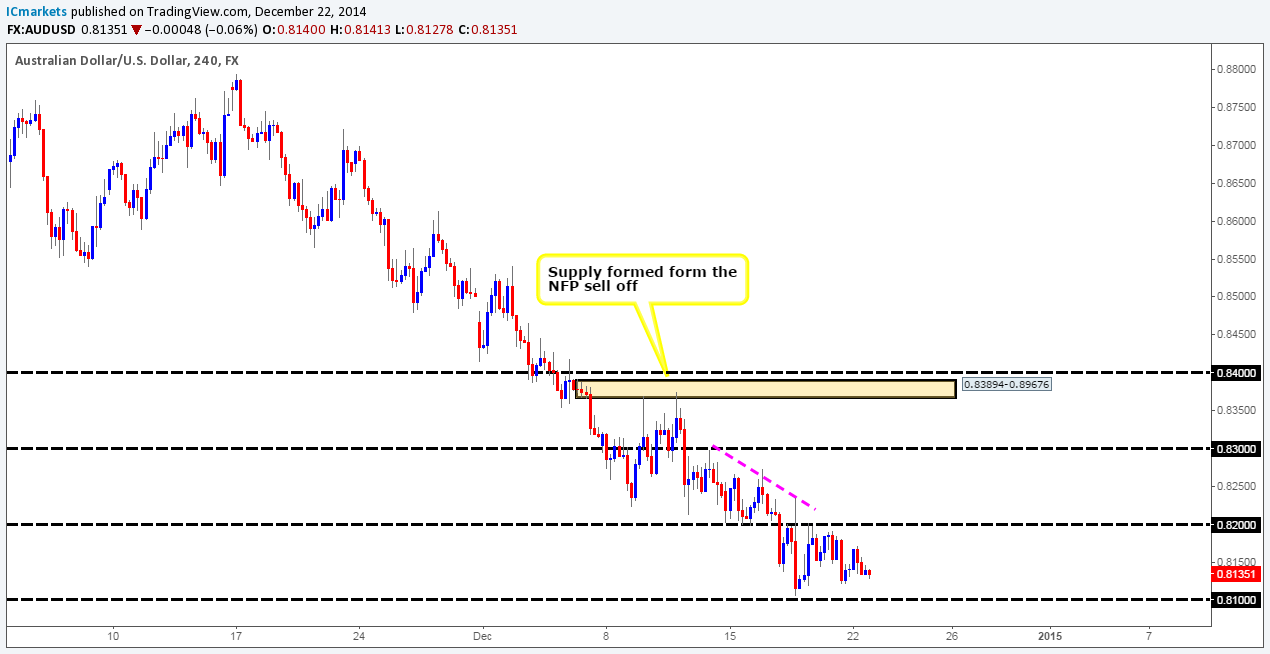
Weekly Timeframe: The Aussie Dollar continues to receive punishment as the U.S Dollar forces prices deeper into a major weekly demand area at 0.80646-0.84601. A break below this area may promote further selling down towards another weekly demand area seen at 0.76999-0.79740. Let’s see what we can find on the lower timeframes.
Daily Timeframe: Buyers and sellers are currently battling for position relatively deep within a daily demand area seen at 0.80809-0.82270 (located deep within the aforementioned weekly demand area). For us to be convinced that the buying interest here is legit, price would need to break above the high 0.82734. On the other hand, if further selling continues to be seen, and price breaks below this daily demand area, the path south would then likely be clear down towards a daily Quasimodo support area seen at 0.76999-0.78349 (located deep within the weekly demand area mentioned above at 0.76999-0.79740).
4hr Timeframe: The 4hr timeframe shows that since the open (0.81416), the AUD/USD has seen very little movement. As a consequence of this, much of our previous analysis still remains valid.
We know that from the higher timeframe analysis that the overall bias for the Aussie is south at the moment, even though price is currently trading within higher-timeframe demand (see above). This week would only see us buying the Aussie if the market closed above and retested the round number 0.82, as the path north would then likely be clear up to at least 0.83. The reason being is simply because we believe there to be consumed supply to the left marked with a pink trend line – check out the supply consumption wicks at: 0.82354/0.82734. If however, the market decides to continue selling off, and pushes below 0.81and successfully retests it as resistance (potentially a tradable short here with lower-timeframe confirmation), we could then likely wave goodbye to both the major weekly demand area at 0.80646-0.84601, and the daily demand area seen at 0.80809-0.82270.
Given the points made above, we have decided to remain flat on this pair and wait for further price action to unfold.
Current buy/sell levels:
- Buy orders: Flat (Predicative stop-loss orders seen at: N/A).
- Sell orders: Flat (Predicative stop-loss orders seen at: N/A).
USD/JPY:
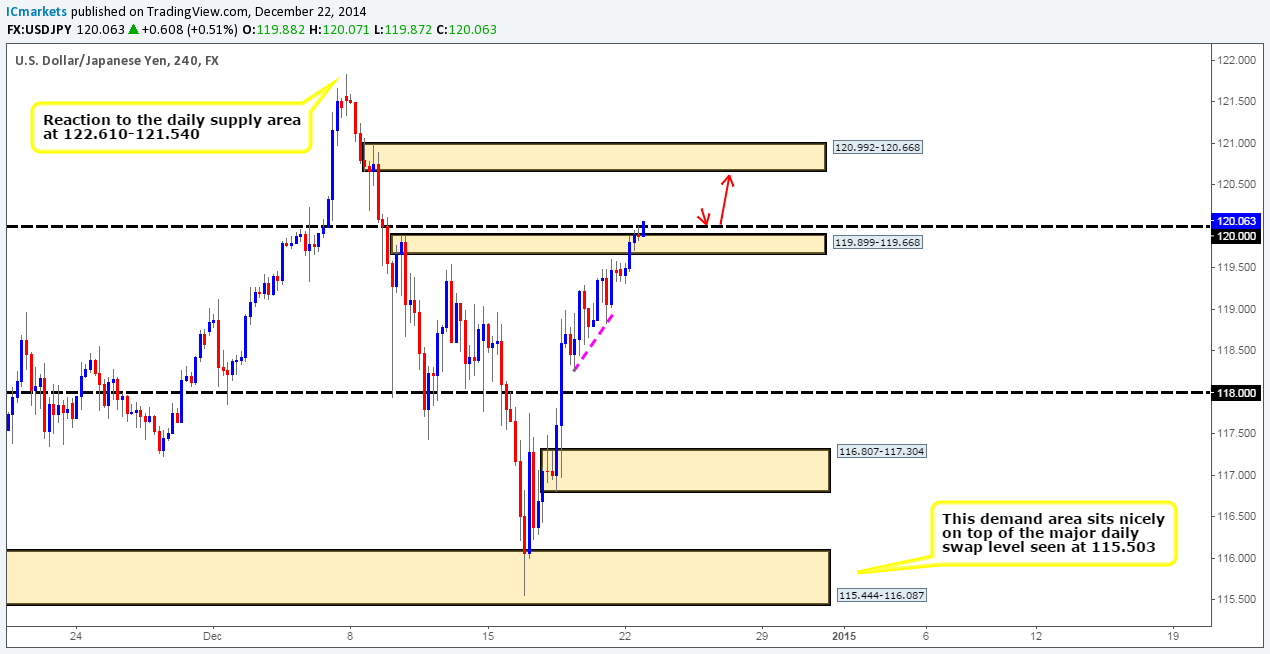
Weekly Timeframe: The weekly timeframe shows that the rebound seen last week from the major weekly swap level (115.503) is currently extending higher. Assuming that the buyers do not lose steam here, we can likely expect prices to test a weekly Quasimodo resistance level seen at 122.180.
Daily Timeframe: The daily timeframe shows that after the daily supply area at 119.196-118.041 was consumed last week, the path north was effectively cleared up to a daily supply area seen at 121.838-120.668. However, given that the aforementioned weekly Quasimodo resistance level (encapsulated by a daily supply area at 122.610-121.540) is lurking just above this area of supply, we expect this area to be faked.
4hr Timeframe: As reported in the previous analysis, we were reluctant to sell this pair because of where price is currently located on the higher timeframes (see above). Effectively, we have seen very little selling interest on this pair since the open (119.494), and this has consequently forced price above a small 4hr supply area (119.899-119.668) into the round number 120. In the event a close above here is seen, there could potentially be an opportunity to buy the retest targeting the 4hr supply area above at 120.992-120.668.
From now until Christmas Eve, we’re only looking for trades with small targets, essentially looking to play the bounces, as irregular liquidity can sometimes distort what would normally be tradable price action.
Current buy/sell levels:
- Buy orders: Flat (Predicative stop-loss orders seen at: N/A).
- Sell orders: Flat (Predicative stop-loss orders seen at: N/A).
USD/CAD:
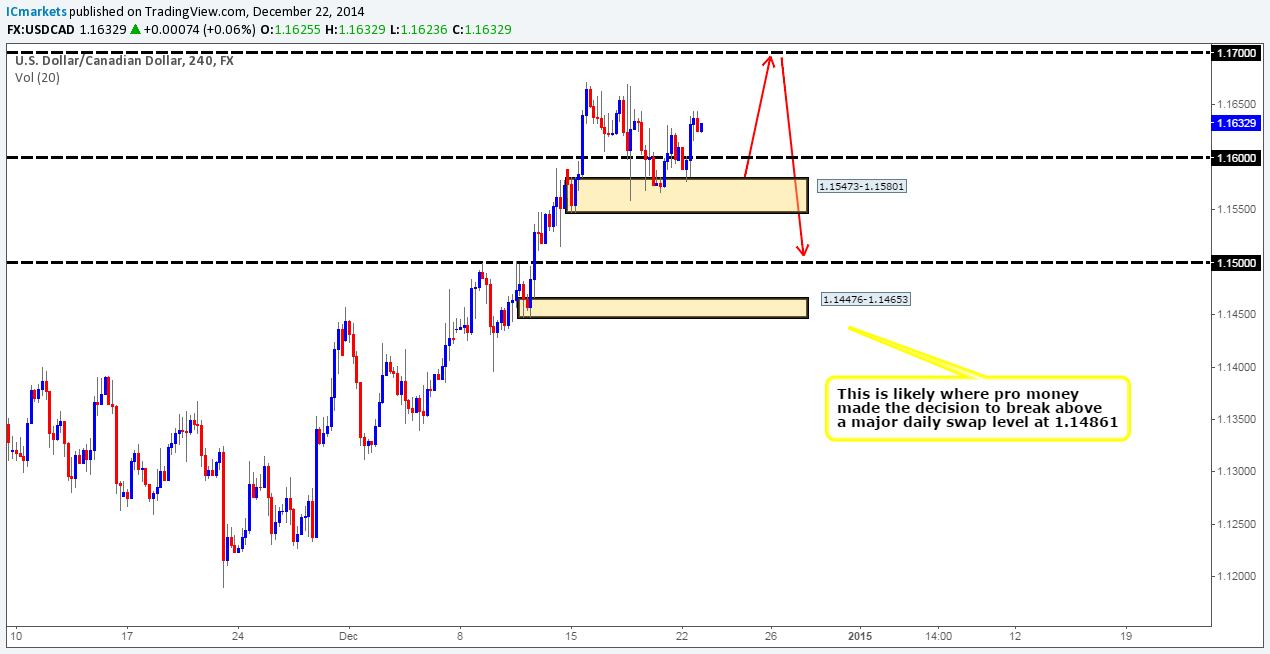
Weekly Timeframe: The weekly timeframe shows that price is currently trading deep within a weekly supply area coming in at 1.17225-1.15417 (surrounded by a larger weekly supply area seen at 1.18061-1.14739). Does this mean we can expect selling to be seen this week?
Daily Timeframe: The daily timeframe shows that selling interest seen from a daily supply area last week at 1.17225-1.16182 (located very deep within the weekly supply area mentioned above at 1.17225-1.15417) has recently been challenged from buyers off of a daily channel support line (prior resistance – channel limits can be seen at 1.11211 (29/10/14) 1.13601 (16/10/14). This is likely not a good sign for anyone currently short this market at the moment. Let’s take a look to see what we can find on the 4hr timeframe.
4hr Timeframe: A small decline in value was seen around the open (1.15976) down towards a 4hr demand area coming in at 1.15473-1.15801. Overall, the market has not seen much change from a technical standpoint, and as a result much of our previous analysis still holds true.
We still feel that the USD/CAD pair is extremely overbought, as both the weekly and daily timeframes show that price is trading around supply (see above) at the moment. The only thing we see currently holding the market higher is the aforementioned 4hr demand area. So, should we all be selling now?
Let’s attempt to look at this from another angle. There are likely an unimaginable amount of traders thinking exactly the same ‘sell, now is definitely the time to sell’. Pro money is aware of this! With that being the case, would you, if you were an institutional trader want all the retail/hedge fund traders selling with you consuming your liquidity? The short answer to this is: ‘No’. Therefore, with all these sell orders getting pumped into the market now, pro money may be gobbling them up to push prices higher towards 1.17 before the overall sell off can commence, this would cause the utmost panic and confusion to anyone who has already sold and likely force them to close their positions, handing over their buy stops (once a seller closes a position it automatically becomes a buy) for pro money to sell into (this provides the much-needed liquidity for well-funded traders). If price reaches 1.17 early this week, we will look to take advantage of any possible move south, assuming we have corresponding lower-timeframe confirmation that is.
On a side note, this week, most professional investors are likely on vacation, so our theory regarding pro money above may or may not work out, so please do bear that in mind if considering selling around 1.17, this is partly the reason why we NEED lower-timeframe confirmation there too!
Current buy/sell levels:
- Buy orders: Flat (Predicative stop-loss orders seen at: N/A).
- Sell orders: We will be watching the 1.17 level for lower-timeframe selling confirmation (Predicative stop-loss orders seen at: Dependent on where one confirms the level).
DAX 30:
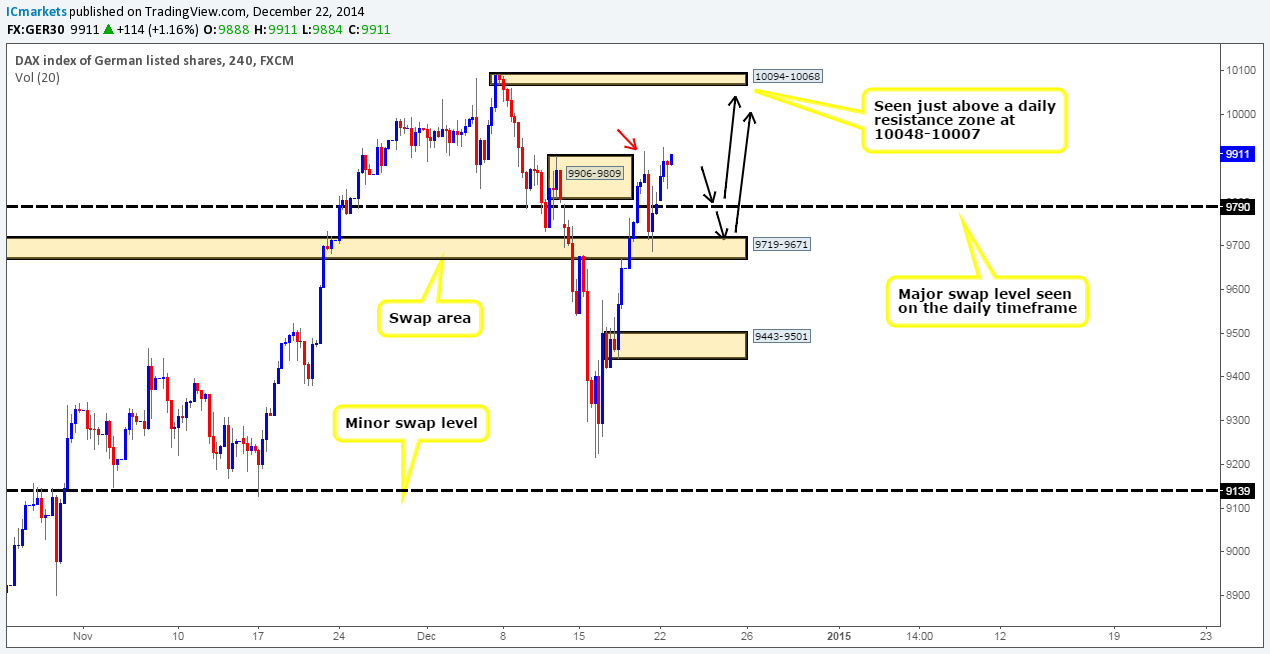
Weekly Timeframe: The rebound seen last week from the weekly decision-point demand area at 9126-9467 is currently extending higher. Assuming that the buyers remain confident here, we could potentially see prices hit the 10048 mark sometime soon.
Daily Timeframe: The recent buying seen on the DAX has forced prices to close (9911) above a minor daily swap level coming in at 9896. This – as a consequence has likely cleared the path north towards a small daily resistance zone seen at 10048-10007.
4hr Timeframe: It was reported in the previous analysis that we believed most of the supply/sell orders around the 4hr supply at 9906-9809 had already likely been consumed by the wick seen marked with a red arrow at 9919. We also mentioned that if the buyers were able to hold price above 9790, which they have, we then felt there was a good chance that the index will see an increase in value up to a small 4hr supply area coming in at 10094-10068 (seen just above the daily resistance zone at 10048-10007).
Unfortunately though at this point in time, we do not see any safe entries long to take advantage of this potential move higher. However, if the sellers bring the market down to 9790, the major weekly swap level, we’d watch the lower timeframes like a hawk around 9797 for a confirmed entry north looking to target 10062. Assuming that this level fails, and price continues lower down towards the 4hr swap area seen at 9719-9671, we’d be confident entering here with a pending by order at 9728. We would likely treat this trade this as a scalp up to 9790 until proven otherwise.
Current buy/sell levels:
- Buy orders: 9797 [Tentative] (Predicative stop-loss orders seen at: dependent on where one confirms the level) 9728 (Predicative stop-loss orders seen at: 9659).
- Sell orders: Flat (Predicative stop-loss orders seen at: N/A).
DOW 30:
Weekly Timeframe: The rebound seen off the ignored weekly Quasimodo level at 17135 has at the time of writing extended higher. Even with the low volume expected this week, could we possibly see a break above the 17988 high sometime today? Let’s see what the lower timeframes have to offer.
Daily Timeframe: The daily timeframe shows that yesterday was clearly one for the buyers as price closed above a daily Quasimodo resistance level at 17893. In the event that the buyers can hold out above here, we feel it is very likely the high 17988 mentioned above will eventually see a break north.
4hr Timeframe: The 4hr timeframe shows that the only thing that can technically stop price from breaking above the weekly high 17988 is a 4hr supply area coming in at 17988-17960, where at the time of writing a little selling is being seen.
However, after analyzing the price structure from the weekly down to the 4hr timeframe, we are quite confident a break higher is on the cards, as the aforementioned 4hr supply area is already likely weak from the spike seen marked with a black arrow on the 08/12/14 at 17960. The daily Quasimodo resistance level at 17893 will likely provide adequate support allowing active buyers to step into the market and push price above 17988 (weekly high). Therefore, we intend to watch price action very carefully on the lower timeframes around the 17902 mark for a confirmed buy signal to take advantage of this prospective rally higher.

Current buy/sell levels:
- Buy orders: 17902 [Tentative] (Predicative stop-loss orders seen at: dependent on where once confirms the level).
- Sell orders: Flat (Predicative stop-loss orders seen at: N/A).
XAU/USD (Gold):
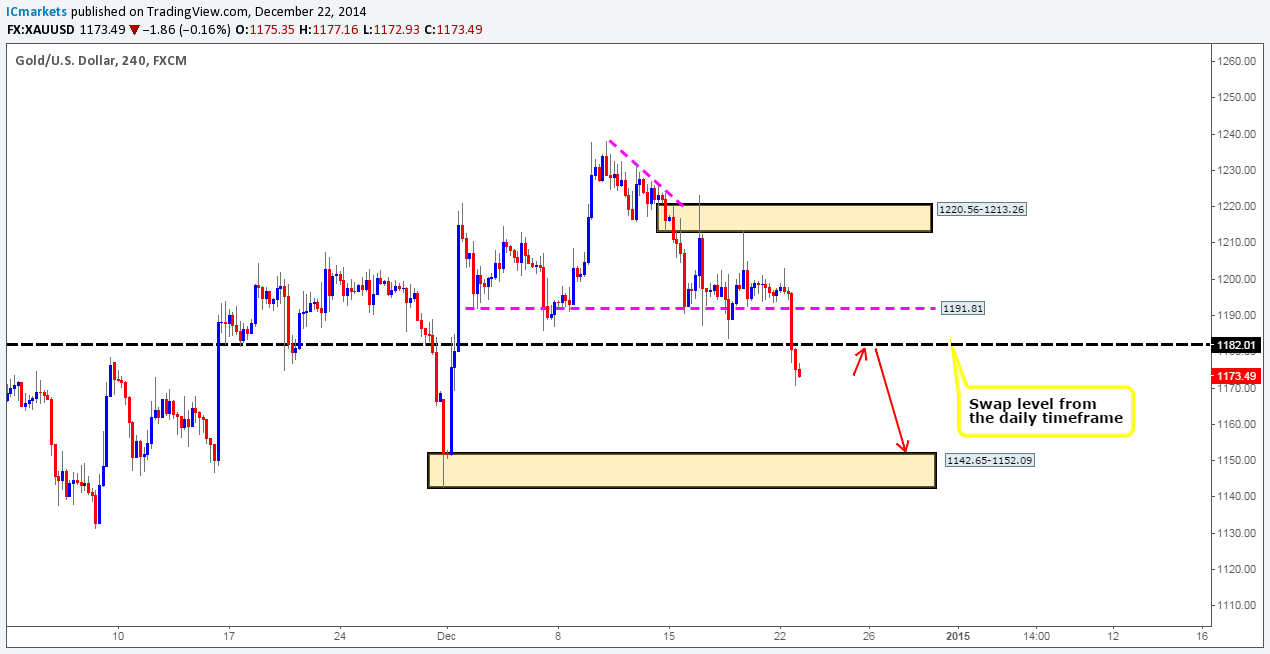
Weekly Timeframe: The rebound seen from the weekly supply area at 1255.20-1226.18 appears to be extending lower at the time of writing. Assuming that further selling is seen from here, we see very little stopping prices from hitting 1136.30, a weekly decision-point demand level.
Daily Timeframe: The daily timeframe shows that Gold has positively closed below a major daily swap level coming in at 1182.01. In the event that the sellers can hold the market below here, we feel there is a good chance that prices could hit a clear level of daily support coming in at 1149.42.
4hr Timeframe: A potential shorting opportunity may be setting up on Gold at the moment. Similar to the daily timeframe, if the sellers can successfully hold prices below 1182.01, we will likely see further selling down to a 4hr demand area coming in at 1142.65-1152.09, which coincidentally surrounds the aforementioned daily support level, and this move is something we want to be a part of!
Ultimately, we would like to see buyers push price back up to 1182.01, and from there we’ll be watching the lower timeframes like a hawk for a confirmed sell signal around 1181.49. The reason we require confirmation here is for two reasons, the first because it is the holiday season and liquidity will be low which means violent swings can transpire, and secondly, the only logical area for a stop loss is just above 1191.81, which is too big for us. We only have one target for this retest trade and that is 1153.34, just above the aforementioned 4hr demand area, as per the red arrows.
Current buy/sell levels:
- Buy orders: Flat (Predicative stop-loss orders seen at: N/A).
- Sell orders: 1181.49 (Predicative stop-loss orders seen at: dependent on where one confirms this level).
The post Tuesday 23rd December: Daily technical outlook and review (Japan – Bank holiday today) appeared first on .
Source:: Tuesday 23rd December: Daily technical outlook and review (Japan – Bank holiday today)


