
Previous Story
Tuesday 25th November: Daily technical outlook and review
Posted On 25 Nov 2014
Comment: 0
EUR/USD:
Weekly Timeframe: The weekly timeframe is currently showing that the buyers and sellers are battling it out within a major combined weekly demand/Quasimodo support area at 1.22403-1.24420/1.22866. In the event that the buyers outweigh the sellers here, prices will likely rally higher and test a weekly support swap level coming in at 1.25816.
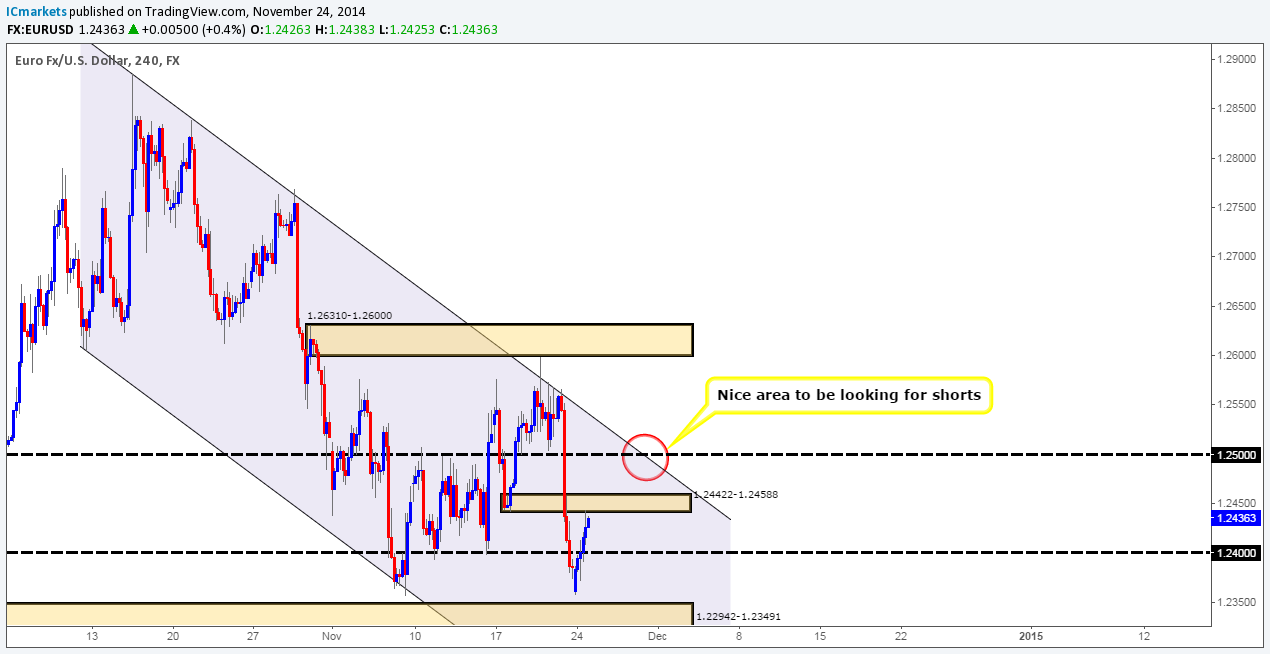
Daily Timeframe: The current situation on the daily timeframe shows that price has been, and still is consolidating between a daily supply area at 1.26386-1.25459 (surrounds the aforementioned weekly support swap level), and a long-term daily demand area coming in at 1.22877-1.23809 (located relatively deep within the aforementioned combined weekly demand/Quasimodo support area). Let’s take a look on the 4hr timeframe to see what we can find.
4hr Timeframe: The 4hr timeframe shows that the buyers ultimately took control once the market opened at 1.23617, with the sellers showing little to no interest.
We mentioned in the previous analysis that our team had mixed views concerning the direction in which this pair will likely take – this still remains to be the case. 50% are looking for sells due to the fact that the Euro has been in a downtrend for longer than we can remember, while the other half are looking for buys since price is currently located around higher-timeframe demand (see above). This has consequently forced us to take trades ONLY if we see corresponding lower-timeframe confirmation.
At the time of writing, price is trading around a 4hr demand swap area at 1.24422-1.24588, where we are presently watching the 5/15 minute timeframes for confirmation to enter short (1.24401). Assuming that the sellers take control here, a move south may ensue down to 1.24. At this point, we’ll be looking to enter long – again with lower-timeframe confirmation around 1.24044, targeting 4hr resistance coming in at 1.25 that conveniently lines up beautifully with the current downward trending channel resistance (upper/lower limits: 1.28859/1.26043).
Buy/sell levels:
- Buy orders: 1.24044 [Tentative] (Predicative stop-loss orders seen at: 1.23882).
- Sell orders: 1.24401 [Tentative] (Predicative stop-loss orders seen at: 1.24657).
GBP/USD:
Weekly Timeframe: The situation on the weekly timeframe shows that price action is currently contained between a weekly demand area seen at 1.54260-1.56110, and a weekly resistance swap level coming in at 1.57166.
Daily timeframe: At the time of writing, price is still trading within a daily decision-point demand area at 1.55602-1.56802 (located within the weekly demand area mentioned above at 1.54260-1.56110). Nonetheless – like the weekly timeframe, the 1.57166 resistance barrier is currently holding the market lower resulting in tight ranging action being seen.
4hr Timeframe: Technically, not much has changed since the market opened (1.56345), and as a result, much of our previous analysis remains the same.
In our view, the GBP/USD is in a state of consolidation right down from the weekly timeframe to the 4hr. The 4hr timeframe currently shows dreamy price action for range traders due to the market being firmly trapped between a 4hr supply area at 1.57208-1.56927 (surrounds the weekly resistance swap level at 1.57166), and a 4hr demand area seen at 1.55917-1.56299 (located within both weekly and daily demand – see above). Tentative buy orders are seen around 1.56340, and sells at 1.56887. Using lower-timeframe confirmation to enter here is recommended, as it will probably save you from unnecessary losses that may occur if a fakeout is seen. We do hope some of our readers took advantage of the move from the 1.56340 area yesterday! There was great confirming price action on the 5-minute timeframe.
Price is currently seen trading around the aforementioned 4hr supply area – be on the lookout for lower-timeframe confirmation to sell here. A break above on the other hand would likely force prices up to a 4hr supply area coming in at 1.57804-1.57578, and at the same time likely confirm some buying strength has entered the market from the aforementioned higher-timeframe demand areas. It will be interesting to see how price unfolds during today’s sessions.
Buy/sell levels:
- Buy orders: 1.56340 [Tentative] (Predicative stop-loss orders seen at: 1.55816).
- Sell orders: 1.56887 [Tentative] (Predicative stop-loss orders seen at: 1.57400).
AUD/USD:
Weekly Timeframe: The weekly timeframe currently shows that price has been respecting the limits of a long-term down-trending channel (upper/lower limits – 0.97569/0.88468) for quite some time now. However, for the time being buying and selling has been taking place between an ignored weekly Quasimodo support level seen at 0.88189, and a weekly Quasimodo support level seen below coming in at 0.85769.
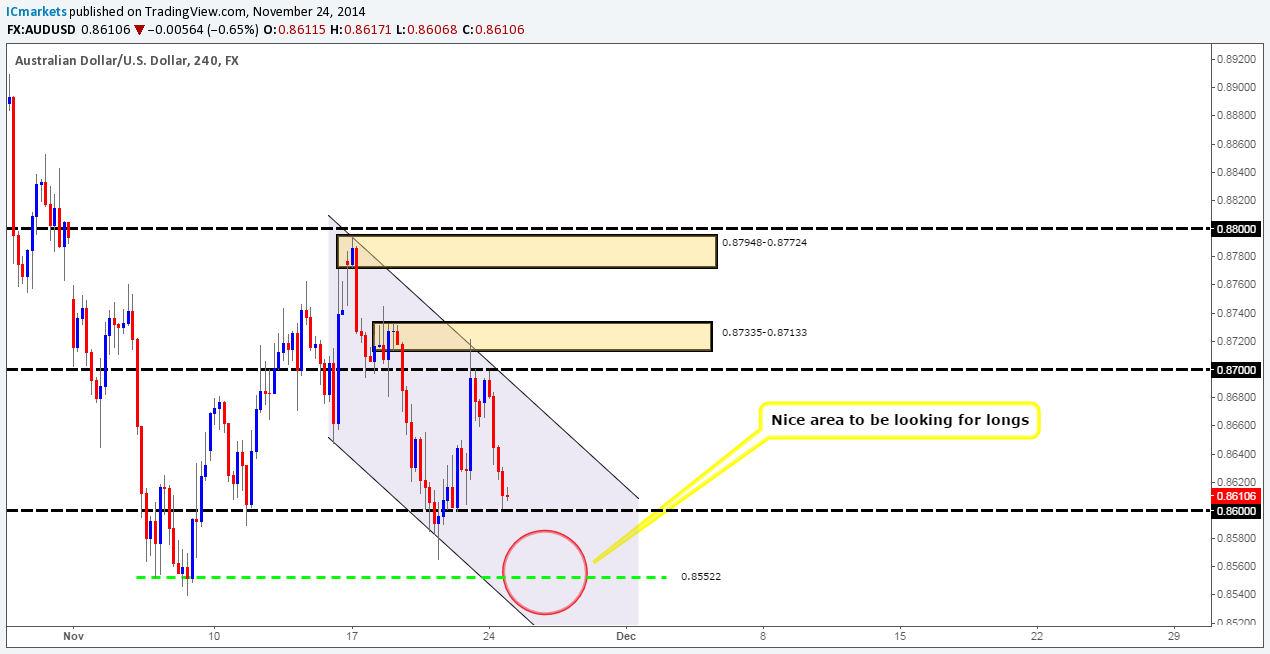
Daily Timeframe: The situation on the daily timeframe shows that the buyers and sellers have been trading between 0.85769 (weekly Quasimodo support level), and 0.87556, an ignored daily Quasimodo support level. Let’s see if we can find any short-term opportunities on the 4hr timeframe.
4hr Timeframe: The buyers were seen taking overall control once the market opened at 0.86776 bringing prices up to 0.87, where at which point a sell off ensued down towards 0.86.
As already mentioned above, the higher timeframes are in a phase of consolidation with no directional movement being seen. As such, any trade taken on this pair MUST be confirmed using lower-timeframe price action, and targets for those trades should be kept small and easily managed.
Assuming that the market breaks below 0.86, we would then be watching a 4hr Quasimodo support level at 0.85522 like a hawk. Buying interest is expected to be seen around 0.85573, and assuming we have confirmation from the lower timeframes, we will certainly consider buying here. This level is particularly interesting given the fact that it’s located near to the aforementioned weekly Quasimodo support level, and has extra support coming in from the 4hr downward trending channel (upper/lower limits: 0.87948/0.86742).
Buy/sell levels:
- Buy orders: 0.85573 [Tentative] (Predicative stop-loss orders seen at: 0.85367).
- Sell orders: N/A (Predicative stop-loss orders seen at: N/A).
USD/JPY:
Weekly Timeframe: Last week saw the USD/JPY pair advance to a fresh high of 118.968 as price continued on its relentless march north. This move consequently spiked above a major weekly supply area coming in at 117.931-116.799. Was this spike a fakeout to gather liquidity for lower prices, or a continuation move for a rally higher? Let’s see what we can find on the lower timeframes.
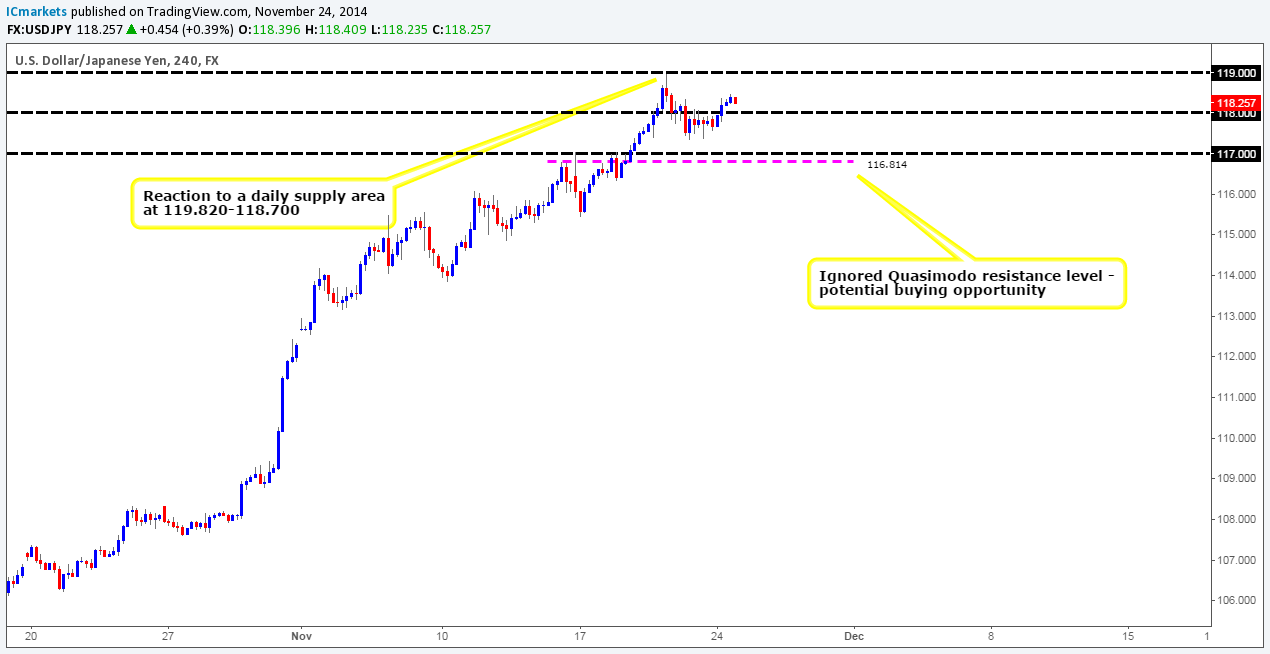
Daily Timeframe: Current trading action on the daily timeframe shows that price is stalling after hitting a daily supply area coming in at 119.820-118.700, which is located just above the aforementioned weekly supply area. That being the case, for the current weekly spike to be a fakeout, follow-through selling would need to be seen from here, preferably closing below a daily decision-point demand area coming in at 115.297-116.095. On the other hand, if price trades higher and consumes the daily supply area, we would know with a high probability that prices will likely continue north.
4hr Timeframe: The 4hr timeframe shows that the buyers took overall control since from the open (117.874). This consequently saw prices close above 118 once again. In the event that the buyers can hold out above here (tentative buy orders are seen just above at 118.059) and close above 119, this could be an early sign of weakness within the aforementioned daily supply area, and also likely confirm that the weekly timeframe spike was indeed a continuation move.
It will be interesting to see how price action unfolds later on today.
Buy/sell levels:
- Buy orders: 118.059 [Tentative] (Predicative stop-loss orders seen at: 117.690).
- Sell orders: N/A (Predicative stop-loss orders seen at: N/A).
EUR/GBP:
Weekly Timeframe: The weekly timeframe shows that price has been, and still remains to be consolidating between a weekly resistance level seen at 0.80328, and a major weekly demand area coming in at 0.76931-0.78623. Let’s take a look on the lower timeframes to see what we can find.
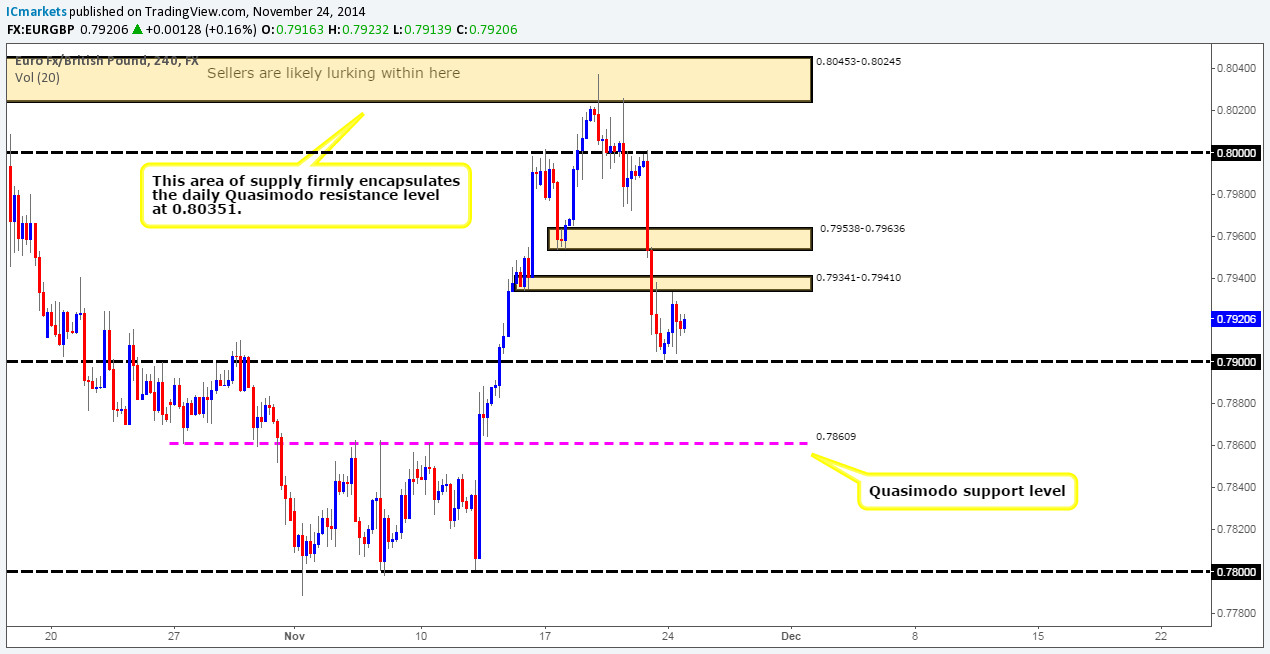
Daily Timeframe: The daily timeframe reveals that buying interest is currently being seen off of an ignored daily supply area at 0.79109-0.78917. Assuming that further buying is seen from here, the market could potentially test the weekly resistance level seen at 0.80328 once again (see above).
4hr Timeframe: For anyone who read our previous report on this pair, you may recall us mentioning to watch for lower-timeframe confirmation around 0.79, for either a move higher or a break below. As we can all see price held beautifully which unfortunately would have been a hard trade to catch, since there was very little corresponding lower-timeframe confirmation around the opening candle (0.79047).
At this point in time, we do not see any trading opportunities on this pair until price either breaks below 0.79, which could present a nice ‘break and retest’ trade, or the buyers push prices above a 4hr demand swap area coming in at 0.79341-0.79410. This move could potentially force the market towards an ignored 4hr demand area coming in at 0.79538-0.79636.
Buy/sell levels:
- Buy orders: N/A (Predicative stop-loss orders seen at: N/A).
- Sell orders: N/A (Predicative stop-loss orders seen at: N/A).
USD/CAD:
Weekly Timeframe: Three weeks ago, selling interest came into the market a few pips below a major weekly supply area coming in at 1.18061-1.14739, consequently encouraging follow-through selling. As per this timeframe, it appears the path south is potentially clear down to at least 1.09394, since we believe most of the near-term demand has already likely been consumed – check out the demand consumption tails seen at 1.11211/1.10807. Let’s see what we can find on the lower timeframes.
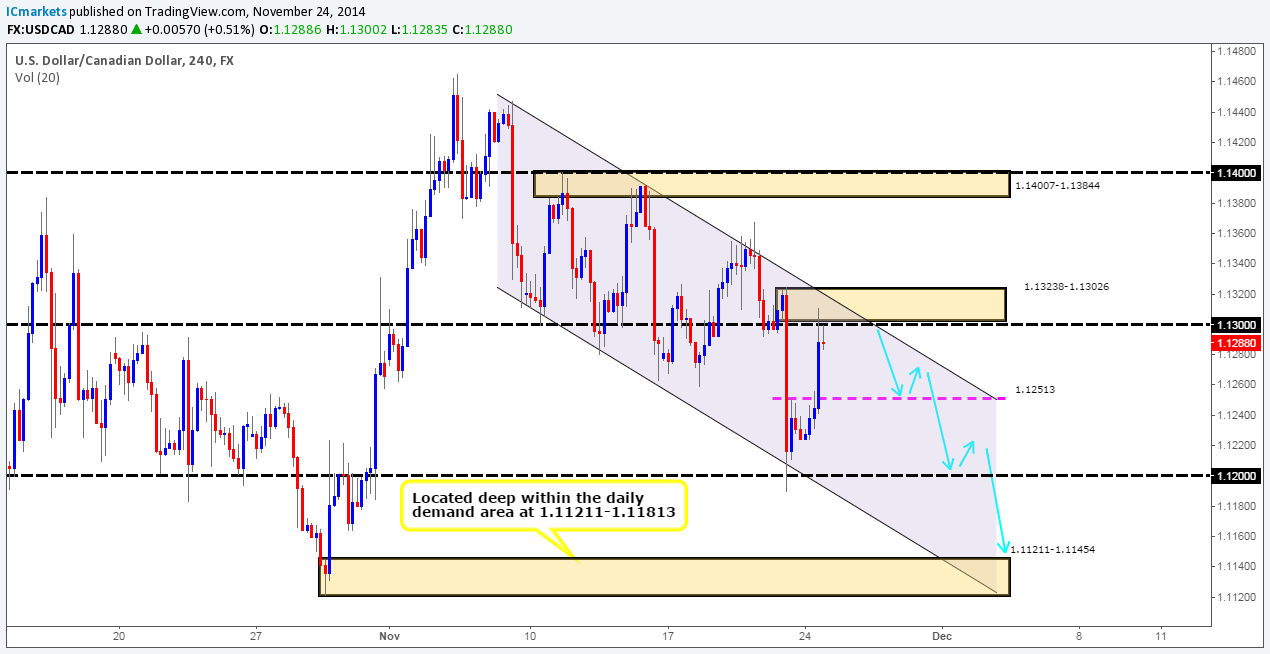
Daily Timeframe: For further selling to be seen from the aforementioned weekly supply area, a daily demand area at 1.11211-1.11813 will need to be consumed. Be that as it may, yesterday’s trading action saw buying interest coming into the market forcing prices up to a minor daily supply area coming in at 1.13681-1.13024. Assuming that this area holds the market lower, we can likely expect the sellers to challenge the aforementioned daily decision-point demand area, which was so very close to being hit on Friday.
4hr Timeframe: For anyone who read our previous report on the USD/CAD pair, you may recall us mentioning that we would be comfortable placing a pending sell order just below the 4hr supply area seen at 1.13238-1.13026. True to our word, as soon as price breached the 4hr demand swap area at 1.12575- 1.12674 (seen on Friday’s chart), we placed a pending sell order at 1.12979, which has recently been filled.
Ultimately, what we’re looking to see price do this week is decline in value down towards a 4hr demand area at 1.11211-1.11454 (located deep within the daily demand area mentioned above at 1.11211-1.11813). It will be here where an important decision will need to be made.
Anyone who also sold around the 1.12979 area – be on your guard for some buying opposition to be seen around 1.12513, and the round-number level 1.12 as per the blue arrows.
Buy/sell levels:
- Buy orders: N/A (Predicative stop-loss orders seen at: N/A).
- Sell orders: 1.12979 [Live] (Predicative stop-loss orders seen at: 1.13276).
USD/CHF:
Weekly Timeframe: For the past three weeks now, price has been stalling around a weekly supply area coming in at 0.98378-0.96993, which is obviously not a good sign for anyone who sold here. Let’s take a look at the lower timeframes to see what we can find.
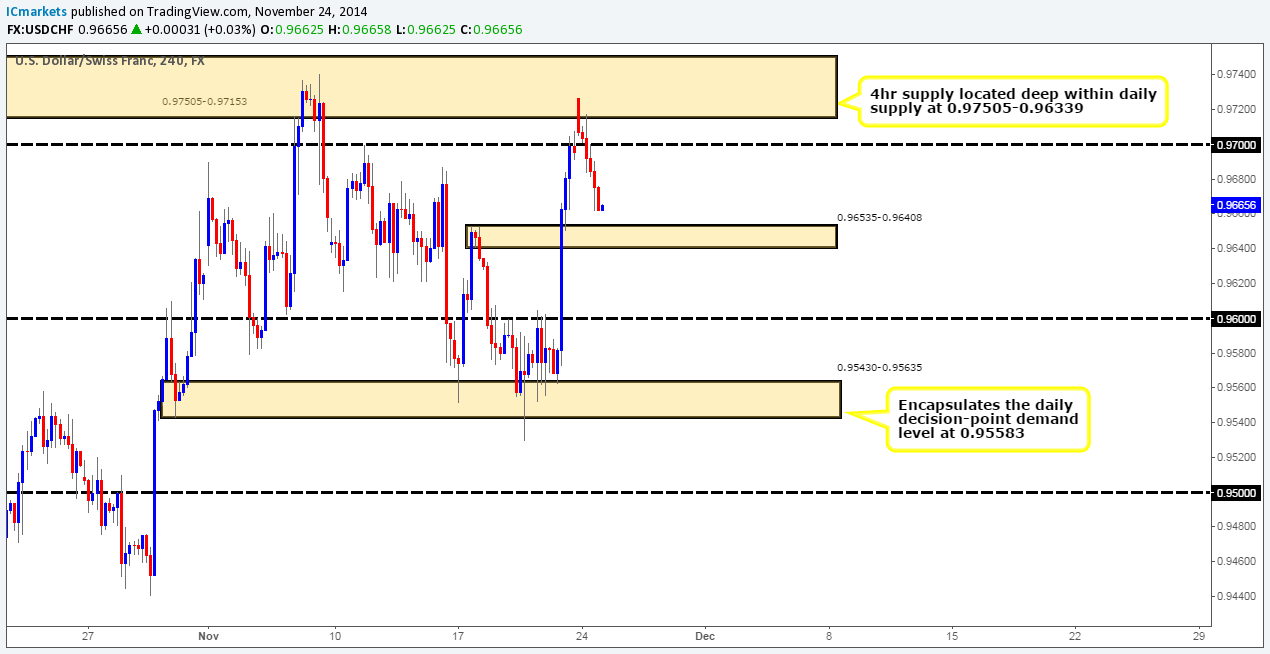
Daily Timeframe: The current situation on the daily timeframe shows that price is ranging between a major daily supply area at 0.97505-0.96339 (located within the aforementioned weekly supply area), and a small daily decision-point demand level coming in at 0.95583. Further selling cannot be seen until this level of demand is consumed which for the time being appears to be a relatively strong barrier. It will be interesting to see what the the 4hr timeframe shows.
4hr Timeframe: The 4hr timeframe shows that the market opened 30 or so pips above Friday’s close (0.96961) at 0.97270. As a result, this forced the market into a 4hr supply area seen at 0.97505-0.97153, which is located deep within the aforementioned major daily supply area. In the event that the buyers break above here, this could potentially be an early signal that the weekly supply area mentioned above at 0.98378-0.96993 is weakening.
The sellers for the time being remain in control of this market and have done since the market opened. We see very little from stopping follow-through selling down towards an ignored 4hr supply area coming in at 0.96535-0.96408. It is here (0.96574) that we intend to look for confirmed buying opportunities on the lower timeframes, as we believe the higher-timeframe supply areas could be weakening.
With that being said, if price breaks below this area, we will be watching the action closely for a potential retesting opportunity, and be looking to target 0.96 as our first take-profit level.
Buy/sell levels:
- Buy orders: 0.96574 [Tentative] (Predicative stop-loss orders seen at: 0.96376).
- Sell orders: N/A (Predicative stop-loss orders seen at: N/A).
XAU/USD (GOLD):
Weekly Timeframe: The weekly timeframe shows that price had extended higher last week, which as a result will likely add confidence to the buying strength currently being seen off of the weekly decision-point demand level at 1136.30. At the time of writing, there seems to be very little resistance in the way that could stop prices challenging 1244.08 again. Let’s see what the lower timeframes are showing.
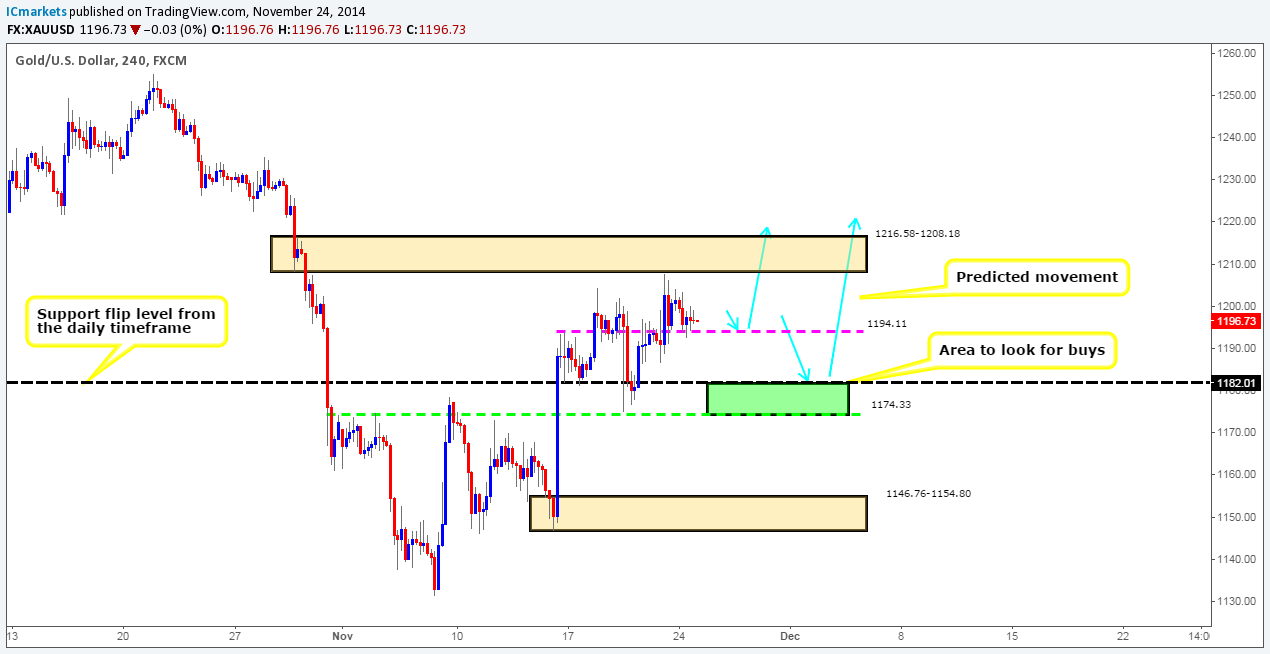
Daily timeframe: In our opinion, as long as the buyers can hold out above the major daily support flip level seen at 1182.01, our bias will remain firmly long. The path north on this timeframe appears to be relatively clear up to at least a daily decision-point supply area coming in at 1235.51-1222.37, just below the weekly 1244.08 level.
4hr Timeframe: With both the weekly and daily timeframes indicating that the market will likely trade higher this week, naturally we’re going to be looking for buying opportunities.
The 4hr timeframe shows that price has recently been trading off of a small 4hr resistance flip level at 1194.11. It was mentioned in the previous analysis to watch for lower-timeframe confirmation around this area (1195.20) for an entry long. The market has already given a signal to buy on the 15 minute timeframe yesterday around 4.45pm GMT, we unfortunately missed this! All is not lost though; we may get another signal – we’re presently watching for price to fakeout below the low 1192.66 before considering buying here again on the 15-minute timeframe.
Back on to the 4hr timeframe, assuming that the 1194.11 level now fails, and price continues south down towards an area marked in green seen between the daily support flip level (1182.01), and minor 4hr resistance flip level (1174.33). This would provide a nice area (1183.11) to watch for lower-timeframe confirmation to enter long, since we would be effectively then trading off of the daily support flip level mentioned above at 1182.01.
Buy/sell levels:
- Buy orders: 1195.20 [Tentative] (Predicative stop-loss orders seen at: Dependent on how one confirms the level) 1183.11 [Tentative] (Predicative stop-loss orders seen at: Dependent on how one confirms the level).
- Sell orders: N/A (Predicative stop-loss orders seen at: N/A).
Source:: Tuesday 25th November: Daily technical outlook and review


