Previous Story
USD/GBP – Intraday technical levels February 18, 2019
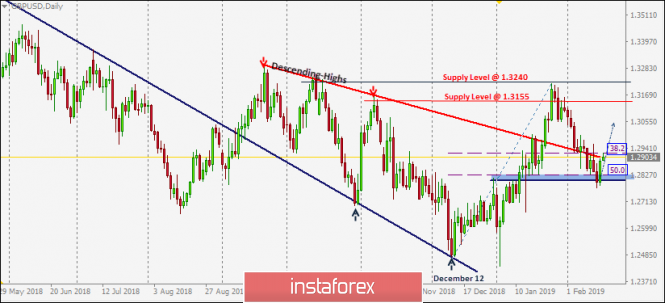
On December 12, the previously-dominating bearish momentum came to an end when the GBP/USD pair visited the price levels of 1.2500 where the backside of the broken daily uptrend was located.
Since then, the current bullish swing has been taking place until January 28 when the GBP/USD pair was almost approaching the supply level of 1.3240.
That’s when the current bearish pullback was initiated around slightly lower price levels near 1.3215 (around the depicted supply levels in RED).
This was followed by a bearish engulfing daily candlestick on January 29. Thus, the GBP/USD pair lost its bullish persistence above 1.3155 as a result.
Hence, the short-term scenario turned bearish towards 1.2820-1.2800 where (50% Fibonacci level) as well as a previous prominent top are located (Highlighted in BLUE) where price action should be watched cautiously.
Lack of bullish demand has been demonstrated on the recent few daily candlesticks until Friday when significant bullish recovery was demonstrated around Fibonacci 50% level (bullish engulfing daily candlestick)
For the bullish side to regain dominance, bullish breakout above 1.2920 (38.2% Fibonacci) should be re-established early.
On the other hand, bearish breakdown below 1.2830 (Fibo 50%level) enhances a further decline towards the price zone of 1.2690-1.2700 where significant bullish demand will probably be demonstrated.
The material has been provided by InstaForex Company – www.instaforex.com
Source:: Intraday technical levels and trading recommendations for GBP/USD for February 18, 2019