
Previous Story
USD/CAD intraday technical levels and trading recommendations for March 6, 2017
Posted On 06 Mar 2017
Comment: 0
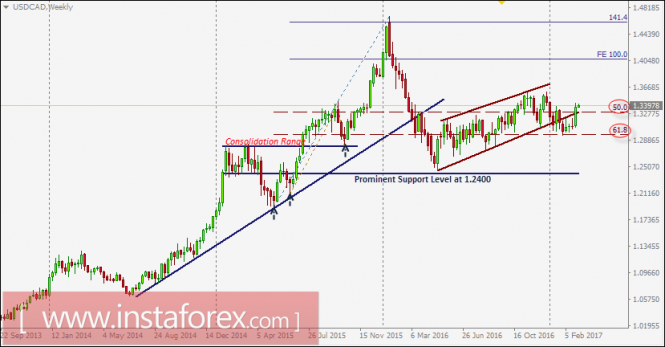
The USD/CAD pair challenged the upper limit of the depicted channel around 1.3360-1.3400 which succeeded to apply enough bearish pressure on the pair.
Shortly after, a bearish engulfing weekly candlestick was expressed by the end of the week indicating strong resistance around 1.3550.
Bearish persistence below the price level of 1.3300 (50% Fibonacci Level) was achieved.
This allowed a further decline toward 1.3200 and 1.3080 (the lower limit of the depicted channel) where bullish rejection was expressed as anticipated.
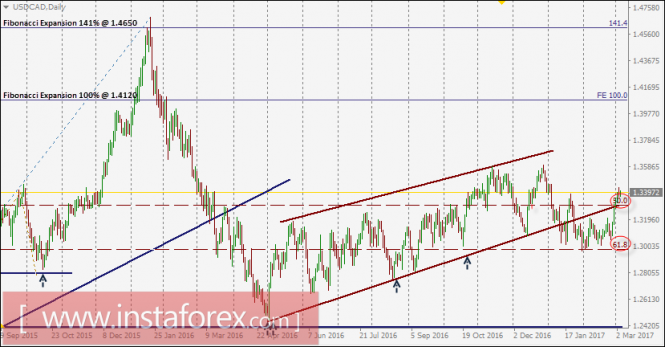
A bullish breakout above 1.3360 (50% Fibonacci level) was expected to allow a further advance toward 1.3700-1.3750 (the upper limit of the depicted channel). However, significant bearish rejection was expressed around 1.3580 (recent established top).
The price level of 1.3300 (50% Fibonacci Level) failed to provide enough support for the recent bearish pullback.
That is why the recent bearish pullback toward 1.2970 (61.8% Fibonacci level) offered a valid BUY entry as expected in the previous articles.
This week, a bullish breakout above 1.3300 (50% Fibonacci Level) is needed to enhance bullish advance towards 1.3440 and 1.3550.
Otherwise, the USD/CAD pair remains trapped within the current consolidation range (1.2970-1.3300).
The material has been provided by InstaForex Company – www.instaforex.com
Source:: USD/CAD intraday technical levels and trading recommendations for March 6, 2017


