How to Use and Draw Trend Lines (Part II)
Today I will be discussing trend lines – an effective support and resistance tool that I keep a close eye on. Traders diligently monitor these levels, as they do with horizontal support and resistance levels.
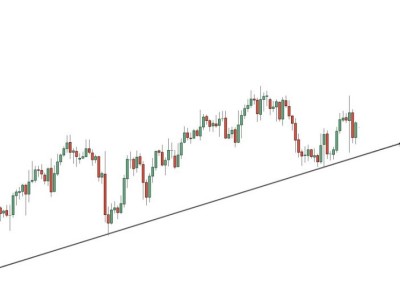
Simple trend lines (also known as ‘diagonal support’ and ‘resistance levels’) offer very precise entries into the market, when used correctly. They can be used on any time-frame, however, as with any other technical tool, the higher the time-frame the more weight that is added.
When it comes to using trend lines, many traders tend to get confused by where to draw them. This is usually because they have been told there is a lot of ambiguity when deciding on what swing point to start drawing from.
As a trader you must remember to use things that standout on a chart. If it’s clear to you, it will be clear to everyone else (especially the larger flows i.e. the guys that move the market).
When it comes to drawing trend lines, I generally look for three things:
1) I want to find two clear points to draw from on the higher time-frame charts. The clearer these are, the better.
2) I consider whether I am looking to trade with the trend or looking at a potential trend reversal.
If price is shooting down the page and I have a clear trend line in place, I generally feel very confident looking for a trade when it comes back to that area. If, however, price has respected the trend line in the past and has now broken and closed on the other side of the trend line (blue circle on chart), I will look to play the back-end retest. This is where resistance becomes support.
3) I recognize that the more touches a trend line has, the weaker it could be.
This is where it can get confusing to a new trader. I have a rule that I look to trade the third touch on the trend line. I generally find these offer the highest probability. If the trend line is attracting lots of attention (in terms of price continuously bouncing off), I use the line as a reference point using confluence (more on this in future articles).
Number three is the most important when it comes to trend lines in my trading.
Conclusion
There are two ways I look to use a trend line. The first is either as support or resistance in the direction of the trend or for the retest once price actually breaks and closes on the other side. The second option is more in line with anticipating a trend reversal.
Both of these options can give very accurate entries into the market. The best advice I can give is to open up a blank chart and just start drawing lines. The more you do it the easier it will become.
P.S. If you want to learn more about how I trade, check out the link below:
Jarratt Davis – Free Forex Course
The post How to Use and Draw Trend Lines (Part II) appeared first on Jarratt Davis.


