
Previous Story
Wave analysis of EUR/USD and GBP/USD for July 1, 2019
EUR / USD
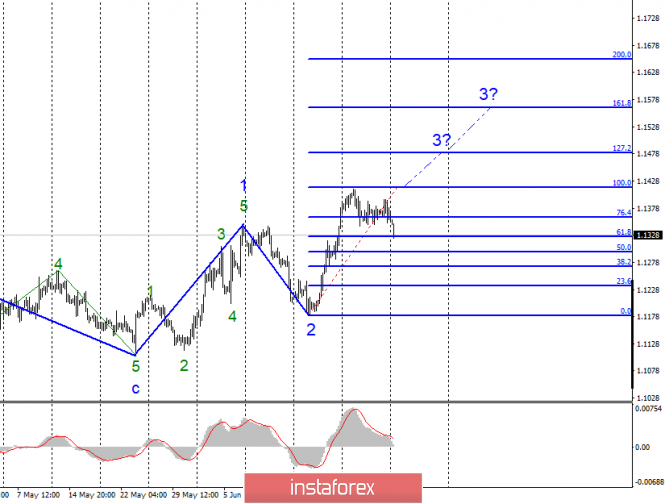
On Friday, June 28, trading ended again for EUR / USD without any exchange rate changes. The foreign exchange market kept a close eye on any reports from Osaka, where the G-20 summit took place. Actually, the market was most interested in possible negotiations between Beijing and Washington at this summit. Donald Trump and Xi Jinping met, called the talks productive, but no particular details were known. However, something still became clear after this meeting. Firstly, there will be no further aggravation of the trade conflict between China and the United States. Secondly, the parties will continue to negotiate. Thirdly, the trade war is still preserved, as already introduced duties will not be canceled. The news background can hardly be called in favor of the US dollar, most likely, it is still neutral. However, the markets took the information about the meeting of Trump and Jinping positively. The wave pattern assumes continuation of the increase within wave 3. If this is true, then the current decline can be interpreted as an internal correctional wave in composition 3. Accordingly, it is necessary to wait for its completion.
Purchase goals:
1.1417 – 100.0% Fibonacci
1.1480 – 127.2% Fibonacci
Sales targets:
1.1180 – 0.0% Fibonacci
General conclusions and trading recommendations:
The euro / dollar pair is presumably located within the 3 waves of the upward trend. I recommend buying Eurocurrency with targets located near the estimated marks of 1.1417 and 1.1480, which equates to 100.0% and 127.2% Fibonacci, with the MACD signal up. Now the correctional wave continues its construction.
GBP / USD
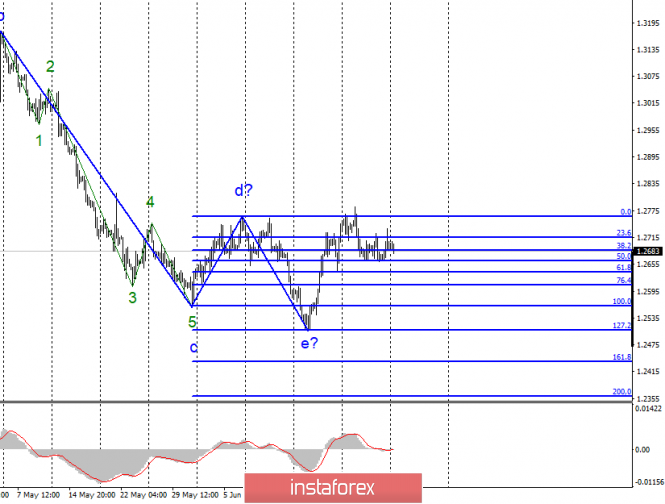
The unsuccessful attempt to break through the maximum of the alleged wave d casts doubt on the readiness of the GBP / USD pair to continue building the upward wave. Actually, before the breakthrough of this maximum, an alternative option, involving the construction of a downward or horizontal trend section, has a fairly high degree of probability of execution. However, the trend section that takes its beginning on March 13 looks fully completed, so the whole wave picture now looks confusing and personifies the events that are happening in the UK not only in recent months, but in recent years. Thus, the news background will continue to decline the tool. A wave marking is about to increase. Today, the PMI index for the manufacturing sector may lead to a departure of quotations from the wave d max.
Sales targets:
1.2434 – 161.8% Fibonacci
1.2359 – 200.0% Fibonacci
Purchase goals:
1.2767 – 0.0% Fibonacci
General conclusions and trading recommendations:
The wave pattern of the pound / dollar instrument has changed and is now suggesting the construction of a new upward trend. At the same time, I recommend waiting for a successful attempt to break through the maximum of wave d, which confirms the willingness of markets to further increase, and only after that, purchases can be made. Up to this point, the pair may be inclined to build a horizontal trend section.
The material has been provided by InstaForex Company – www.instaforex.com


