
Previous Story
Wednesday 10th December: Daily technical outlook and review.
Posted On 10 Dec 2014
Comment: 0
EUR/USD:
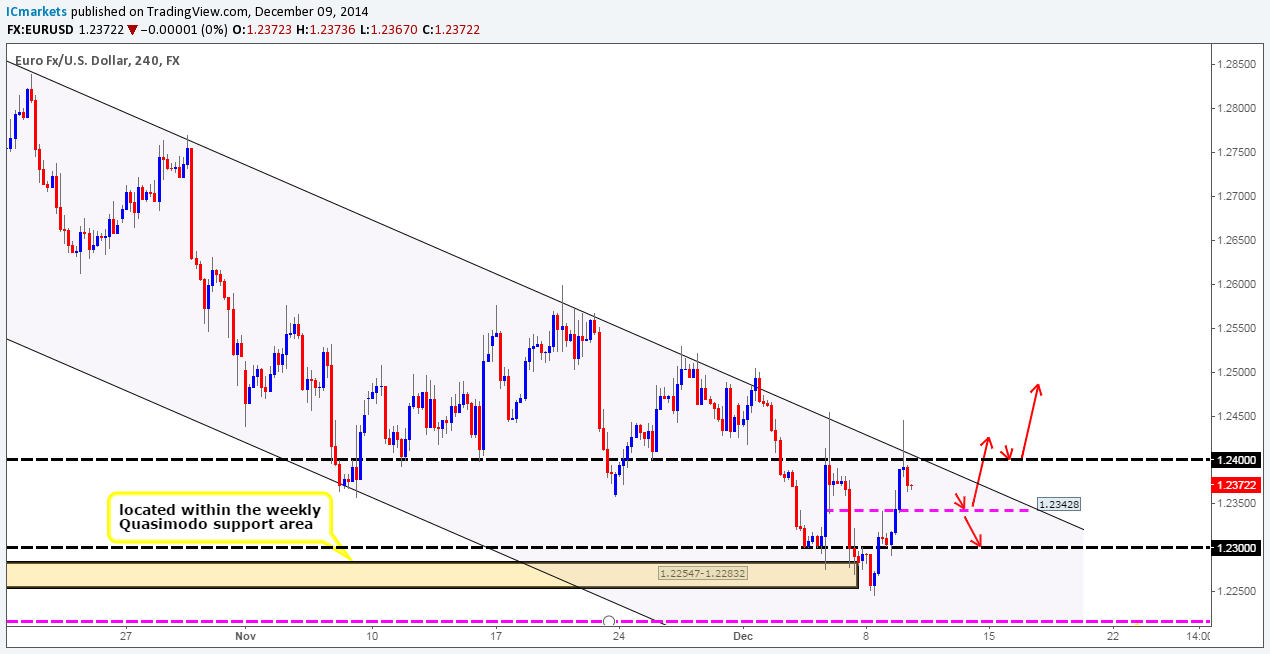
Weekly Timeframe: Further buying has been seen from the weekly Quasimodo support area coming in at 1.22403-1.22942. Will the market continue to rally until it reaches 1.24996, minor weekly swap level? Let’s take a look on the lower timeframes to see what we can find.
Daily Timeframe: The daily timeframe shows that for the Euro to continue rallying, the buyers will need to consume any selling opposition around a small daily supply area seen at 1.25056-1.24180 (seen just below the 1.24996 weekly level). In the event this area is consumed, the path north will be then relatively free up to a daily supply area seen at 1.26386-1.25459 (encapsulates a weekly swap level coming in at 1.25816).
4hr Timeframe: It was reported in the previous analysis that if the market broke and retested 1.23 as support, we’d be interested in buying with our take-profit target set at 1.23633. As we can all see this did indeed play out. We do hope some of our readers took advantage of this 100 pip + move! We personally had our eye on the 15 minute timeframe decision-point demand area seen at at 1.22885-1.22952, but we were unfortunately not at our desks when it hit around 3.45am GMT time – very unfortunate, the risk/reward was mouthwatering!
Only recently, a deep test/spike was seen above 1.24, this very likely stopped a bucket-load of traders out. This wick means selling to us considering that it lines up beautifully with the current channel resistance as well. For any traders currently short, please be aware that this could only be a small bounce and not a reversal south for two reasons:
- We are in higher-timeframe weekly demand (see above) at the moment, and higher prices are expected (in our view).
- Active buyers are likely waiting around 1.23428, a minor 4hr swap level, so watch this area closely.
We do not currently see any opportunities to safely enter the market at the moment; therefore we are going to remain flat for the time being.
Current buy/sell levels:
- Buy orders: Flat (Predicative stop-loss orders seen at: N/A).
- Sell orders: Flat (Predicative stop-loss orders seen at: N/A).
GBP/USD:
Weekly Timeframe: The GBP/USD pair remains confined between a weekly demand area seen at 1.54260-1.56110, and a weekly swap level coming in at 1.57166. A break above would likely force prices to test a weekly swap level at 1.58934. Conversely, a break lower would likely encourage follow-through selling down towards a weekly support level seen at 1.52700.
Daily Timeframe: The daily timeframe shows that active sellers have entered the market around the weekly swap level seen at 1.57166, as reported may happen in the previous analysis. Assuming that the sellers can hold the market below here, a further decline could be seen down towards a daily support level coming in at 1.54344 (seen deep within the aforementioned weekly demand area). Conversely, a break above 1.57166 would likely force the market to test a daily supply area seen at 1.59438-1.58338 (encapsulates the weekly swap level at 1.58934).
4hr Timeframe: The 4hr timeframe shows the market continued to rally until reaching 1.57, where at which point active sellers entered the market. For anyone who sold around 1.57you may find the 1.56249-1.56455 area to be troublesome, as this was likely where pro money made the decision to buy the market up to 1.57.
Let’s quickly recap. The weekly timeframe shows price is currently ranging at the moment (see above), while the daily timeframe shows a daily decision-point demand area 1.55602-1.56802 was recently consumed (in our opinion), which has likely cleared the path down to 1.54344, a daily support level. Therefore with this in mind, we are favoring further selling to be seen.
That being said though, we do currently see any safe entries short until the small 4hr decision-point demand area at 1.56249-1.56455 is consumed. It will be interesting to see how the market unfolds later on today.
Current buy/sell levels:
- Buy orders: Flat (Predicative stop-loss orders seen at: N/A).
- Sell orders: Flat (Predicative stop-loss orders seen at: N/A).
AUD/USD:
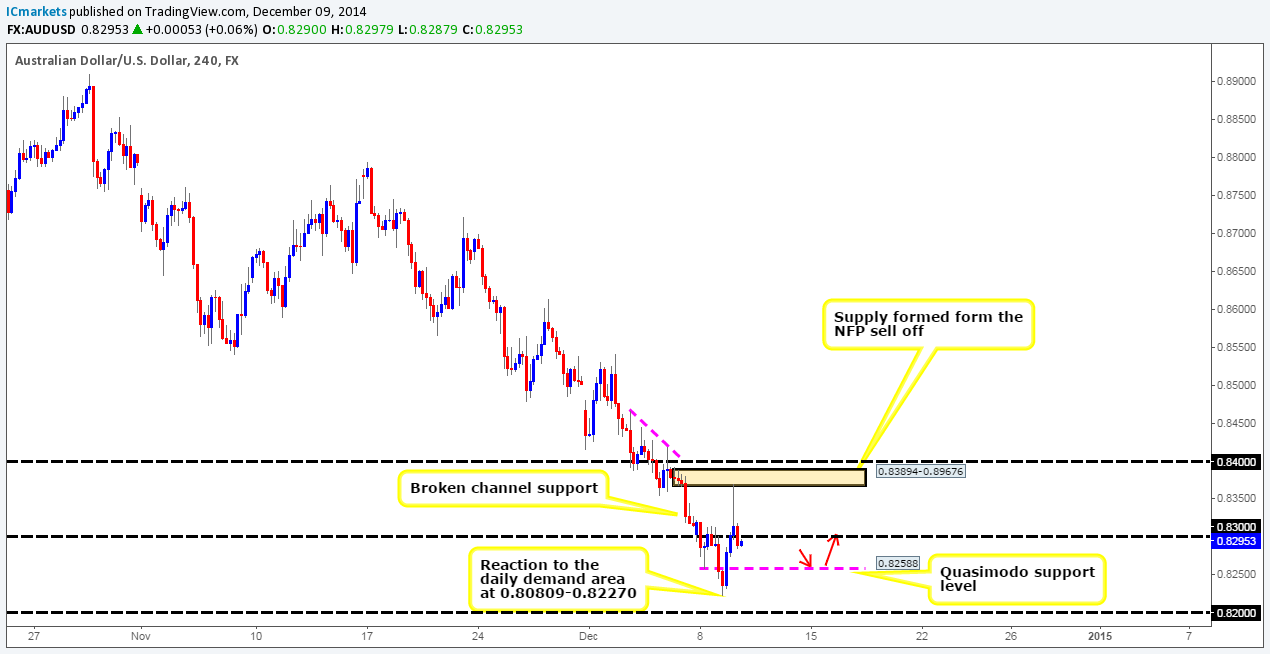
Weekly Timeframe: The weekly timeframe shows that price is reacting off of a long-term downtrend channel support (0.97569/0.88468) seen deep within a major weekly demand area coming in at 0.80646-0.84601.
Daily Timeframe: It was reported in the previous analysis that we should be prepared for price to fake below the daily swap level at 0.82625 into a daily demand area coming in at 0.80809-0.82270, which played out yesterday. With both the weekly and daily timeframe showing the market in demand, we are naturally favoring buy trades at the moment. Let’s see what we can find on the 4hr timeframe.
4hr Timeframe: The 4hr timeframe clearly shows that there were active sell orders around the 4hr supply area seen at 0.83894-0.89676, which has forced the market to trade below 0.83. In the event that further selling is seen, it is likely that prices will test 0.82588, a 4hr Quasimodo support level (tentative buy orders are seen just above at 0.82624). We would not usually consider buying here with prices so close to resistance at 0.83, but with both the weekly and daily timeframes showing prices trading around demand (see above) at the moment, we feel it is worth the risk. However, we will not be blindly placing a buy limit order here; lower timeframe confirmation will be required.
Current buy/sell levels:
- Buy orders: 0.82624 [Tentative] (Predicative stop-loss orders seen at: Dependent on where one confirms the level).
- Sell orders: Flat (Predicative stop-loss orders seen at: N/A).
USD/JPY:
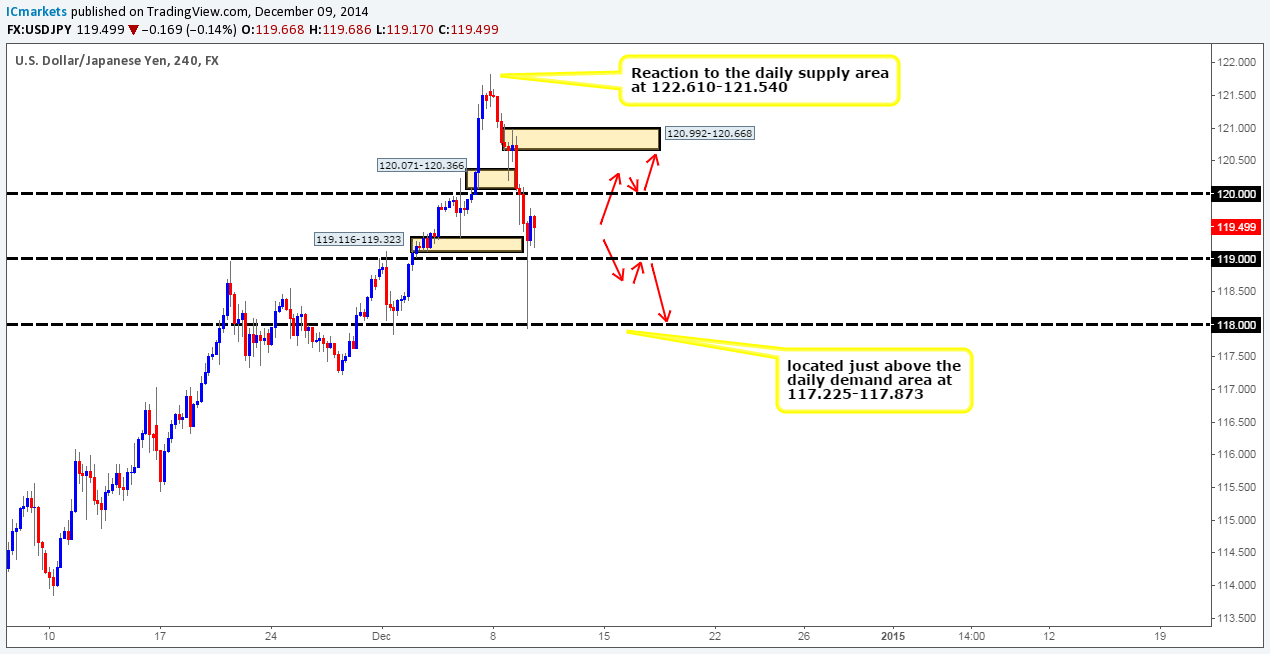
Weekly Timeframe: Relatively aggressive selling has been seen on the USD/JPY pair from just below a weekly Quasimodo resistance level at 122.180. This consequently forced prices down to a weekly supply swap area coming in at 117.931-116.799.
Daily Timeframe: The daily timeframe shows that a small daily demand area at 117.225-117.873 (located within the aforementioned weekly supply swap area) is currently holding the market higher. In the event that this area of demand is consumed, we see very little stopping the prices from declining all the way down to 115.503, a major daily swap level.
4hr Timeframe: For anyone who follows our analysis on a regular basis, you may recall us mentioning that we were looking for buys around the 4hr decision-point demand area seen at 120.071-120.366. At that point in time, we were at our desks but saw no entry north, which was quite fortunate really considering the move only lasted 20/30 pips at best.
A vicious-looking spike has recently been seen from the round number 118 (located just above the aforementioned daily demand area) that forced the market to close above 119.
In our opinion, The USD/JPY pair shows very little direction on both the weekly and daily timeframes (see above), and as such, any trades taken by us will require lower-timeframe confirmation. Price is presently trading between 120, and 119, and is somewhere we would not be comfortable trading due to the high volatility this pair has seen over the past few weeks. A break above would likely force the market to test a 4hr supply area coming in at 120.992-120.668, we’d be watching the lower-timeframe action here for an entry south around the 120.629 mark. Likewise, a break below could attract further selling down towards 118, where again we’d be watching the lower-timeframes for confirmed buying around 118.057.
Current buy/sell levels:
- Buy orders: 118.057 [Tentative] (Predicative stop-loss orders seen at: 117.781).
- Sell orders: 120.629 [Tentative] (Predicative stop-loss orders seen at: 121.073).
USD/CAD:
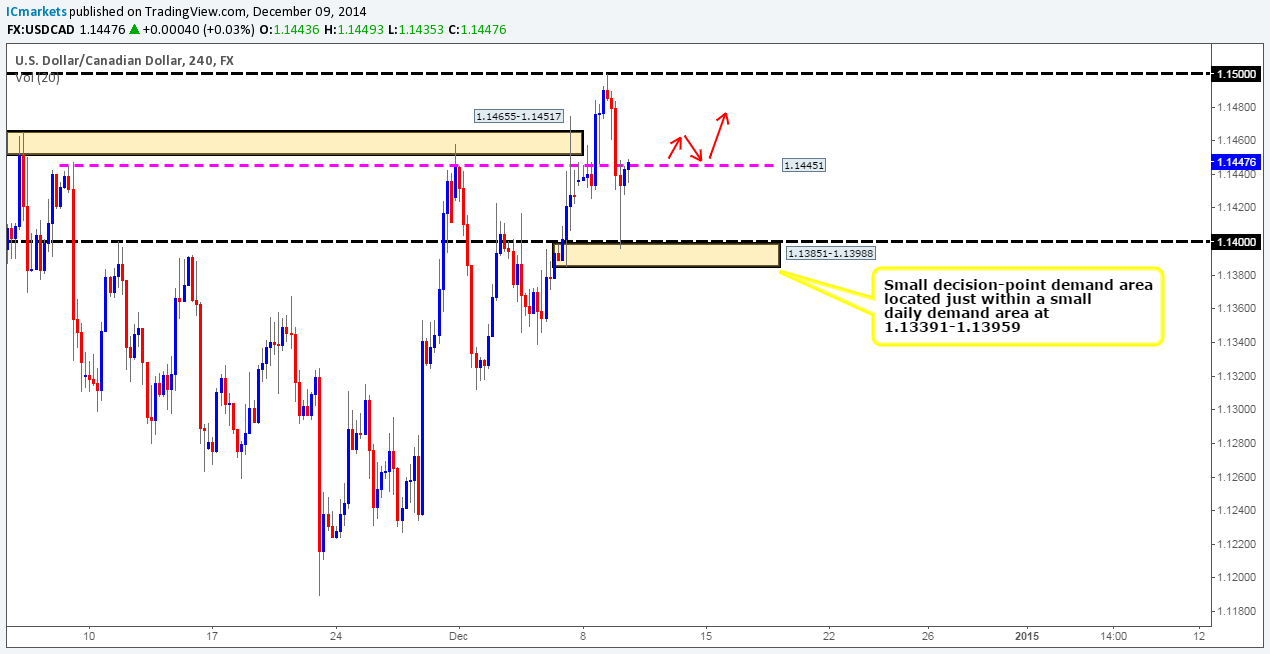
Weekly Timeframe: The weekly timeframe is showing that price trading below a major weekly supply area coming in at 1.18061-1.14739 at the moment. In the event that active sellers enter the market here, we could potentially see prices decline down towards a near-term weekly swap level seen at 1.12231.
Daily Timeframe: The daily timeframe reveals that the sellers have shown interest around a major daily swap level seen at 1.14861. Be that as it may, for the market to continue dropping, the daily demand area at 1.13391-1.13959 would need to be consumed. Let’s see what the 4hr timeframe can offer us.
4hr Timeframe: Following on from the previous analysis, the USD/CAD rallied up to 1.15 (seen within the aforementioned major weekly supply area), where at which point active sellers defended this level. From here, a sell off ensued down towards a small 4hr decision-point demand area seen at 1.13851-1.13988 (located within the aforementioned daily demand area) which saw the market rebound beautifully.
At this point in time, the buyers and sellers are battling for position around a minor 4hr swap level at 1.14451. Assuming that a close above this level is seen, this would be our cue to begin looking for confirmed entries long on the retest, targeting 1.14818. This trade would only be considered a quick scalp in our opinion as we would effectively be trading into higher-timeframe supply (see above).
Current buy/sell levels:
- Buy orders: Flat (Predicative stop-loss orders seen at: N/A).
- Sell orders: Flat (Predicative stop-loss orders seen at: N/A).
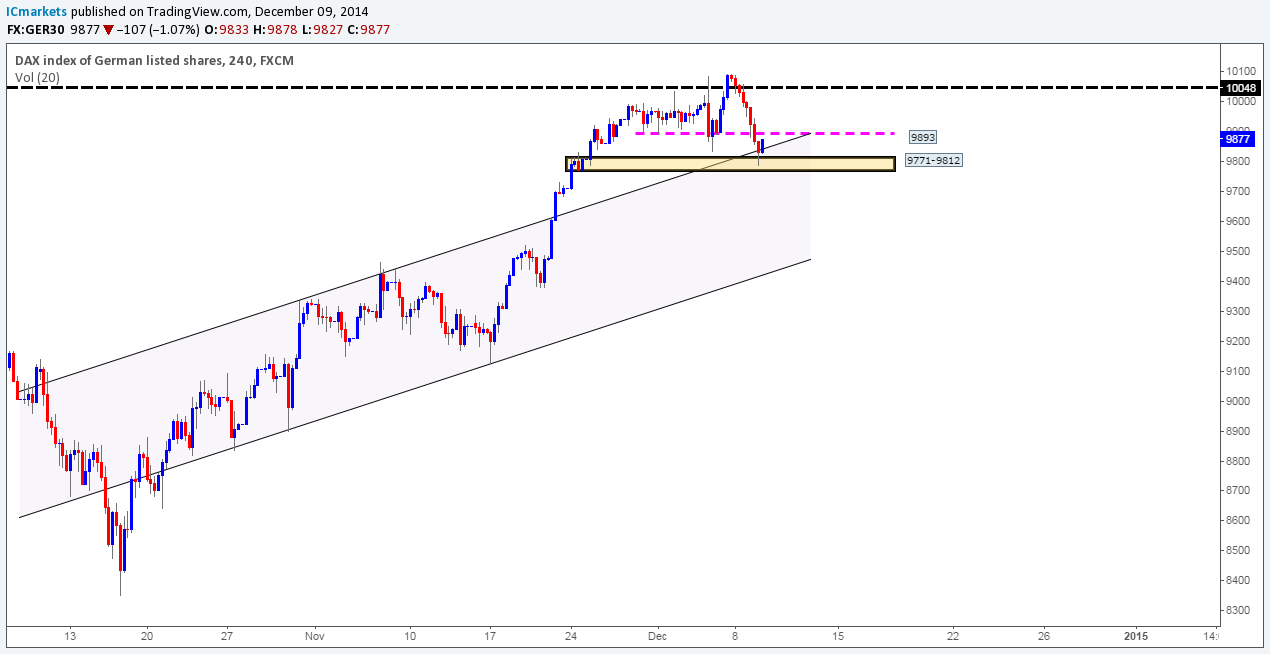
DAX 30:
Weekly Timeframe: The weekly timeframe shows that the DAX advanced to a fresh all-time high of 10094 last week, as price firmly closed above 10048. Be that as it may, it appears that the buyers are struggling defend the 10048 area at the moment, as sellers have drove prices down towards a weekly swap level coming in at 9790.
Daily Timeframe: Yesterday saw the DAX continue to lose ground as prices took yet another tumble. Before the market closed however, buying interest was seen around the aforementioned weekly swap level. A daily close below here would be required to invalidate our current bullish bias.
4hr Timeframe: The 4hr timeframe shows that price is currently reacting off of a beautiful-looking 4hr decision-point demand area coming in at 9771-9812 (encapsulates the aforementioned weekly swap level). This would have been a lovely area to look for short-term buys up to 9893 (4hr swap level) as it also lined up nicely with a channel support which was previous resistance.
If the buyers break above 9893, and retest it as support, we see no reason why prices cannot rally back up to 10048. The break higher would be our cue to begin looking for confirmed buys around 9904. On the other hand, if we see further selling here today, and price closes below the 4hr decision-point demand area, then this could very well be an early signal that a much larger decline is going to be seen, and also could be a chance for us to enter short on a possible retest.
Current buy/sell levels:
- Buy orders: Flat (Predicative stop-loss orders seen at: N/A).
- Sell orders: Flat (Predicative stop-loss orders seen at: N/A).
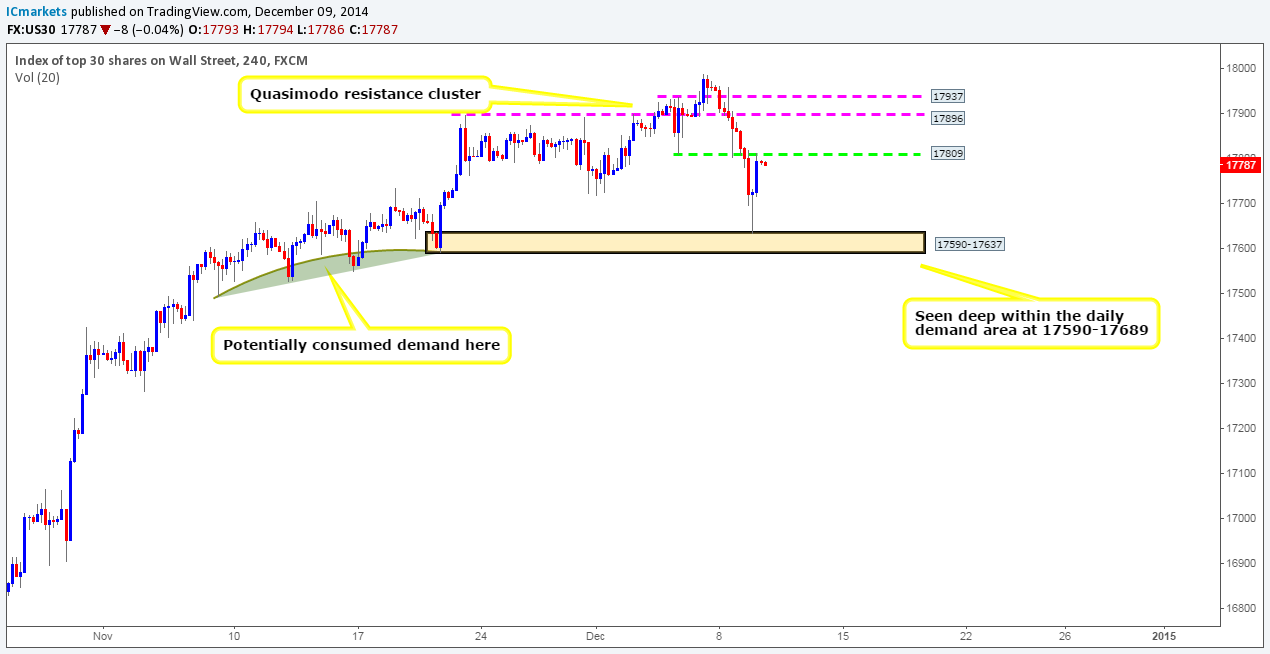
DOW 30:
Weekly Timeframe: The DOW has been trading beautifully within a nice-looking trending channel for over five years, and shows no signs of slowing down just yet. The recently closed weekly candle informed us that the buyers once again remained in control. However, at this point in time, the current weekly candle is showing selling interest from 17972, let’s see what the lower timeframes have to say about this.
Daily Timeframe: The daily timeframe reveals that in order for this index to see further selling, a daily demand area seen at 17590-17689 would need to be consumed. As a consequence, this would likely open the gates for the sellers to challenge a daily decision-point demand area coming in at 17281-17427. Let’s see what we can find on the 4hr timeframe.
4hr Timeframe: The 4hr timeframe shows that the market beautifully reacted off of a 4hr demand area seen at 17590-17637 (located deep within the aforementioned daily demand area). This pushed prices up to 17809, where the buyers and sellers are currently seen battling for position.
Traders interested in selling at this level may benefit from waiting for lower-timeframe confirmation around the 17802/17779 area, since selling here may mean going against higher-timeframe buyers (see above – daily demand). By the same token, if prices close above 17809, this will be our cue to begin watching price action on the lower timeframes for a confirmed entry long targeting 17896, a 4hr Quasimodo resistance level.
Current buy/sell levels:
- Buy orders: Flat (Predicative stop-loss orders seen at: N/A).
- Sell orders: Watching for lower-timeframe confirmation around the 17802/17779 area (Predicative stop-loss orders seen at: Dependent on where one confirms this area).
The post Wednesday 10th December: Daily technical outlook and review. appeared first on .
Source:: Wednesday 10th December: Daily technical outlook and review.


