
Previous Story
Wednesday 12th November: Daily technical outlook and review.
Posted On 12 Nov 2014
Comment: 0
EUR/USD:
Weekly Timeframe: The weekly timeframe shows that a reaction is being seen off of a combined weekly demand/Quasimodo support area seen at 1.22403-1.24420/1.22866. In the event that further buying is seen from here, we see very little in the way stopping prices from hitting the weekly support flip level coming in at 1.27541.
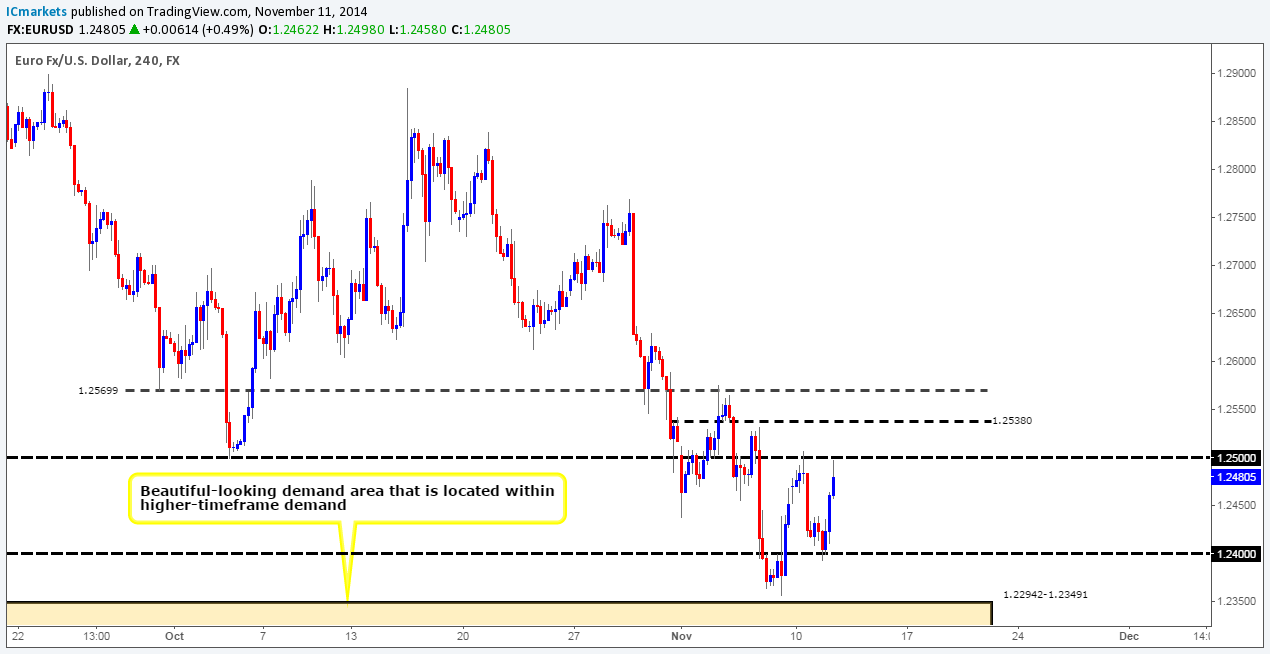
Daily Timeframe: Thanks to the daily timeframe, we know that going long for the time being may not be the best path to take, as price is currently ranging between a small daily supply area at 1.25763-1.24794, and a long-term daily demand area seen at 1.22877-1.23809. It is only once one of these areas is consumed, will we then have some idea on where price is likely to trade to next.
4hr Timeframe: The 4hr timeframe shows that there was a clear buying opportunity around 1.24 with lower-timeframe confirmation. The signal came from the 15 minute chart in the form of a fakeout below the low 1.23936; it was a thing of beauty! The risk/reward was fantastic if one held their position up to 1.25.
We feel that any trade taken on this pair for the time being will require confirmation from the lower timeframes. Touch trading will only be valid once we see some sort of direction from the daily timeframe.
The levels we have our eye on today are as follows: 1.24 – buying here again (1.24057) is something we would consider with the right confirmation. We also still like the look of the 4hr demand area below at 1.22942-1.23491 (located relatively deep within both of the higher-timeframe demand areas mentioned above), an alert has been set around 1.23557 to let us know it’s time to watch the lower timeframes.
Buy/sell levels:
- Buy orders: 1.24057 [Tentative] (Predicative stop-loss orders seen at: 1.23749) 1.23557 [Tentative] (Predicative stop-loss orders seen at: 1.22894).
- Sell orders: N/A (Predicative stop-loss orders seen at: N/A).
GBP/USD:
Weekly Timeframe: Buying interest is currently being seen on the weekly timeframe. This comes after price had spiked through a major weekly demand area at 1.58533-1.60157 last week. Assuming that this is indeed a fakeout, a move to the upside could potentially be seen up to the 1.61837-1.60856 area (weekly supply). Let’s see what the lower timeframes have to say.
Daily Timeframe: In our opinion the daily timeframe is currently showing buying strength, as price has broken above a minor daily support flip level at 1.58736 with room to move up to a small daily decision-point supply area coming in at 1.60210-1.59700.
On a side note, this supply area remains very important to us as it was here that pro money likely made the ‘decision’ to initially break below the aforementioned weekly demand area. If this area of supply is consumed, the path north will likely be free to test 1.61609, a daily support flip level that is located deep within the aforementioned weekly supply area.
4hr Timeframe: The 4hr timeframe shows that price has just recently broken above the round-number level 1.59. Assuming price can close above this level; we see very little reason not to try and attempt to trade the retest targeting a small 4hr supply zone coming in at 1.60008-1.59822, since at the time of writing, we have short-term bullish strength being shown on the daily timeframe (see above) giving us confidence that 1.59 will likely hold (1.59043). However, touch trading psychological levels such as this is always risky, as in our experience these levels are prone to deep tests which normally stops a lot of traders out. Waiting for price-action confirmation on the lower timeframes here works best for us. In the event that price breaks lower, we would definitely consider touch trading the 4hr demand area seen at 1.58338-1.58573 around 1.58604, since this area remains fresh and likely has unfilled buy orders remaining there.
Buy/sell levels:
- Buy orders: 1.59043 [Tentative] (Predicative stop-loss orders seen at: 1.58783) 1.58604 (Predicative stop-loss orders seen at: 1.58283).
- Sell orders: N/A (Predicative stop-loss orders seen at: N/A).
AUD/USD:
Weekly Timeframe: Buying interest is currently being seen on the weekly timeframe. This comes after price had closed below a major weekly demand area at 0.86591-0.88247 last week. If follow-through buying is seen from here, prices could potentially test 0.88874, a weekly support flip level. Let’s see what we can find on the lower timeframes.
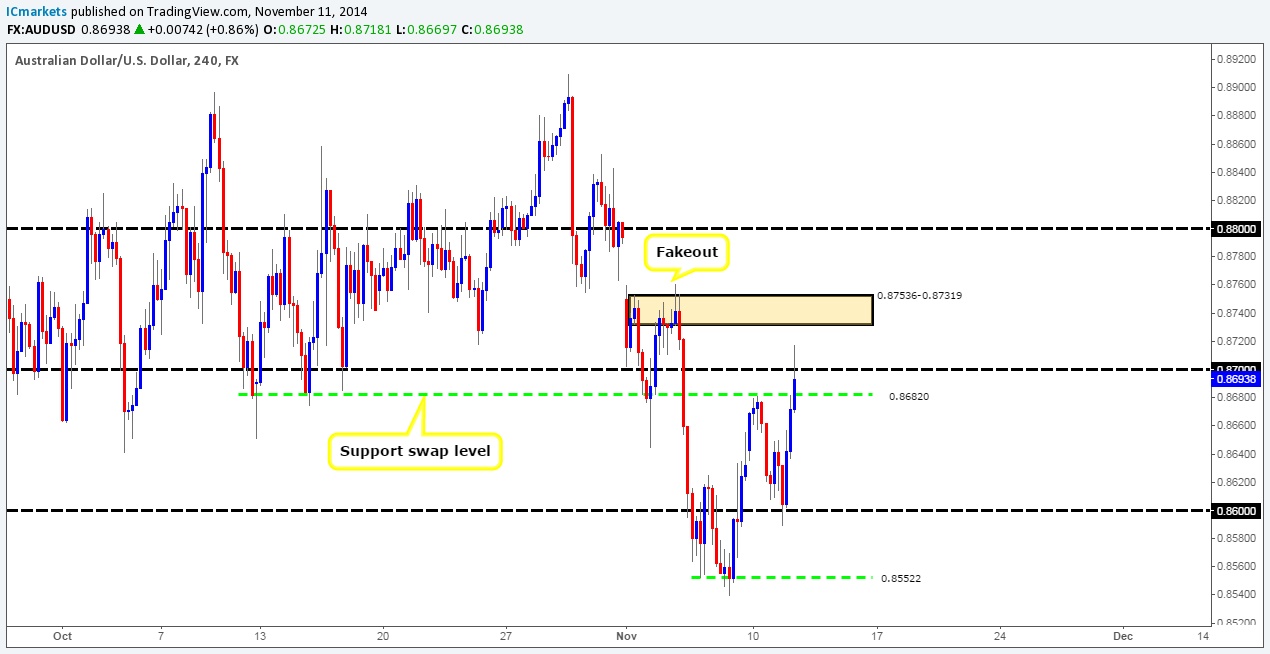
Daily Timeframe: The rebound from the daily resistance flip level at 0.85504 extended higher recently, resulting in price trading around a daily decision-point supply area coming in at 0.87608-0.86798. For us to be convinced that higher prices will likely follow, this important area of supply will need to be consumed.
4hr Timeframe: For anyone who follows our analysis regularly, you may recall us mentioning to watch the lower-timeframe price action around 0.86, and to target 0.87. As we can all see this played out perfectly, we do hope some of our readers locked in some green pips with this 100-pip move.
Price is still currently trading around the 0.87 level where for the time being active sellers are coming into the market. Since price is currently trading within a nice-looking daily decision-point supply area at the moment, we have decided to look for selling opportunities until this supply is consumed (levels above).
With all of the above taken into consideration, we feel there is a good chance that a small rally in price is yet to come on the 4hr timeframe up to a small 4hr supply zone coming in at 0.87536-0.87319 (located deep within the aforementioned daily decision-point supply area). It is here that we would be looking to sell into this market from around 0.87298 with a stop-loss order set just above at 0.87653.
Buy/sell levels:
- Buy orders: N/A (Predicative stop-loss orders seen at: N/A).
- Sell orders: 0.87298 (Predicative stop-loss orders seen at: 0.87653).
USD/JPY:
Weekly Timeframe: The weekly timeframe shows that the USD/JPY continues to rally after price broke above a major weekly supply area last week seen at 114.650-112.530. We feel there is a good chance this rally will continue until price hits a weekly supply area coming in at 117.931-116.799. It will be interesting to see what the lower timeframes show.
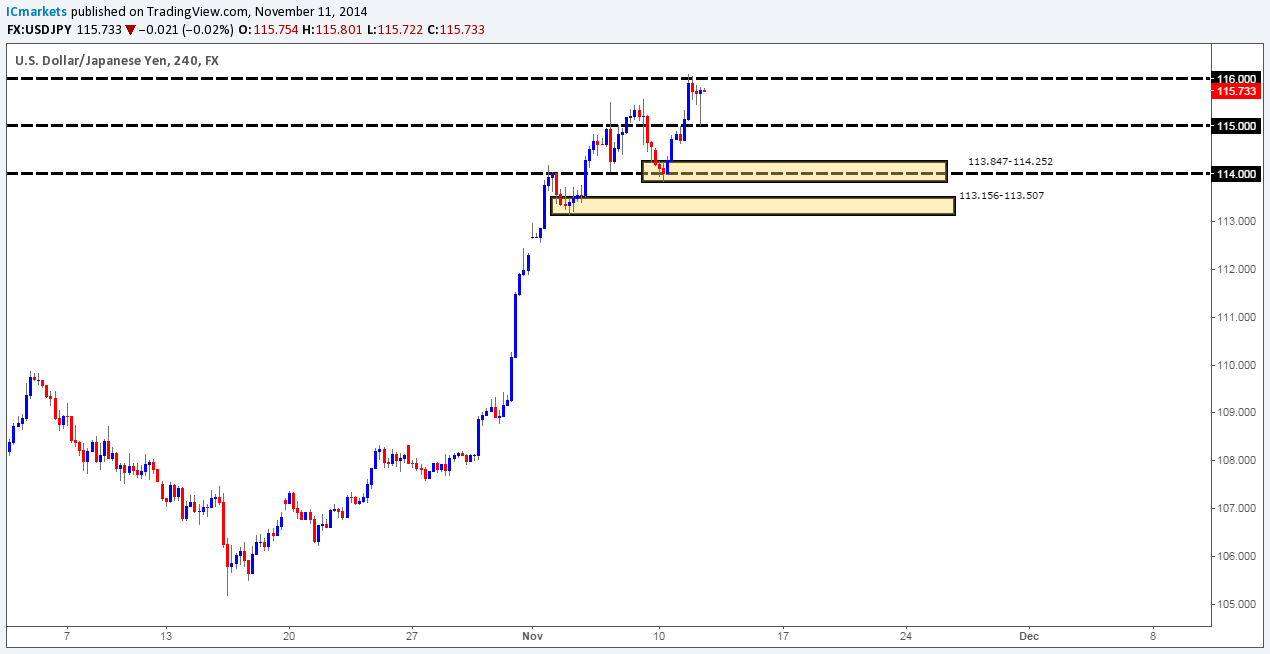
Daily Timeframe: The daily timeframe shows that the daily Quasimodo resistance area seen at 115.911-115.021 has seen a small break above (116.095). This is not a good sign for anyone short this pair at the moment. A small correction could well be seen here since there have likely been a lot of buy stops taken out above this area, which pro money may capitalize on for short-term gain. Ultimately though, we are expecting prices to rally once more up to a daily Quasimodo resistance level at 117.120 (located deep within the weekly supply area mentioned above).
4hr Timeframe: At this point in time, we see very little bearish intention on the 4hr timeframe, as buying interest is seen coming off of 115 – just look at that buying tail (115.015)! For higher prices to be confirmed though, we would like to see a positive 4hr close above 116. From here, we would become very interested in joining this trend on a positive retest of 116 up to at least 117.120, the aforementioned daily Quasimodo resistance level.
Unfortunately, we are unable to access the historical data on this timeframe to see how the price action behaved in the past. Therefore, we have no alternative but to sit on our hands and wait for the current price action to tell us what to do next.
Buy/sell levels:
- Buy orders: N/A (Predicative stop-loss orders seen at: N/A).
- Sell orders: N/A (Predicative stop-loss orders seen at: N/A).
EUR/GBP:
Weekly Timeframe: Price remains trading relatively deep within a weekly demand area seen at 0.76931-0.78623 – a great area to be looking for buying opportunities. Nevertheless, considering where price is currently located, we have not seen much in the way of buying strength over the past few weeks. Let’s see what we can find on the lower timeframes.
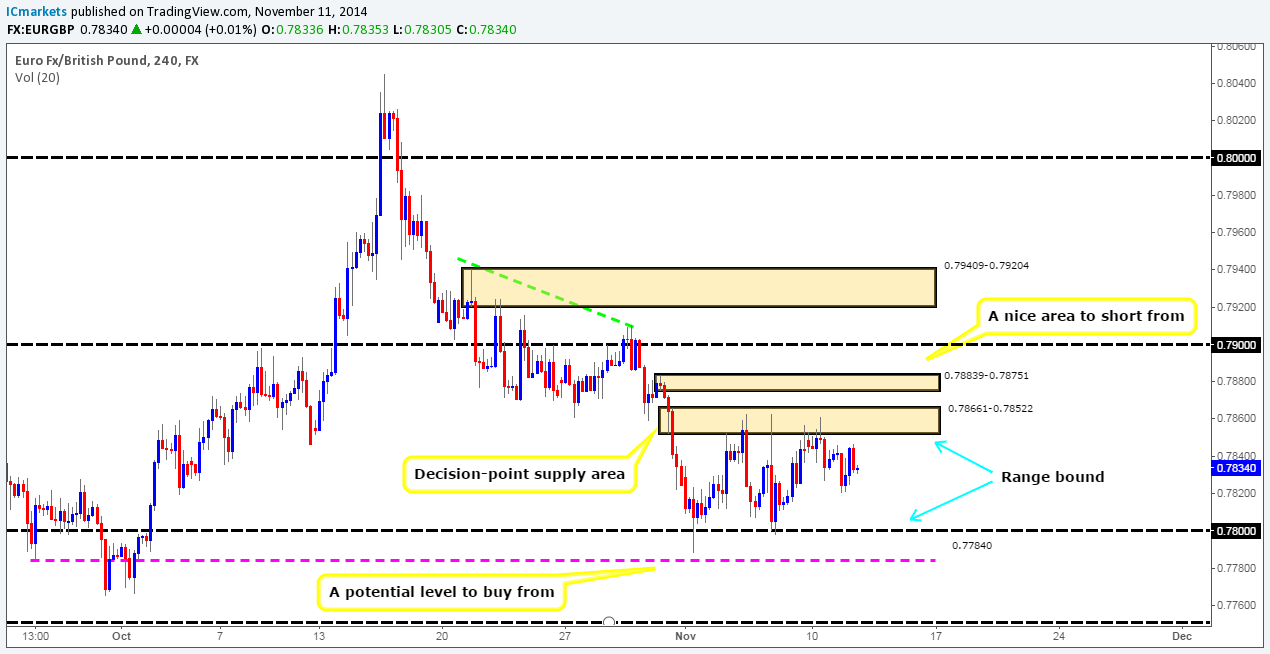
Daily Timeframe: The daily timeframe shows price is continuing to range between a minor daily supply area at 0.79109-0.78609 and 0.78132, a temporary daily support. Ultimately, we would like to see prices close above the daily supply area, as this would likely confirm buying strength from the aforementioned weekly demand area.
4hr Timeframe: The 4hr timeframe – like the daily timeframe continues to consolidate between a 4hr decision-point supply area at 0.78661-0.78522 (located just within the aforementioned daily supply area), and the round-number level 0.78. This is dreamy price action for range traders wishing to play the limits, with potential buying opportunities still being seen at 0.78039, and sells at 0.78495.
However, for us personally, we would rather wait for this range to break, and to then trade off of the oncoming areas. In the event price breaks out north here, we will be looking to sell at 0.78736, just below a fresh 4hr supply area at 0.78839-0.78751 – aggressive trade management would be required here though, since we would actually be selling into higher-timeframe demand (see the weekly analysis above). Likewise, assuming price breaks out south here, we would be looking for buys around 0.77867, just above a 4hr Quasimodo support level at 0.77840. With the above all taken into consideration, we currently favor a breakout north, as price is still located deep within a monster weekly demand area (levels above) at the moment, even if for the time being no bullish activity is being seen there.
Buy/sell levels:
- Buy orders: 0.77867 (Predicative stop-loss orders seen at: 0.77637) 0.78039 [Tentative] (Predicative stop-loss orders seen at: 0.77953).
- Sell orders: 0.78495 [Tentative] (Predicative stop-loss orders seen at: 0.78688) 0.78736 (Predicative stop-loss orders seen at: 0.78865).
USD/CAD:
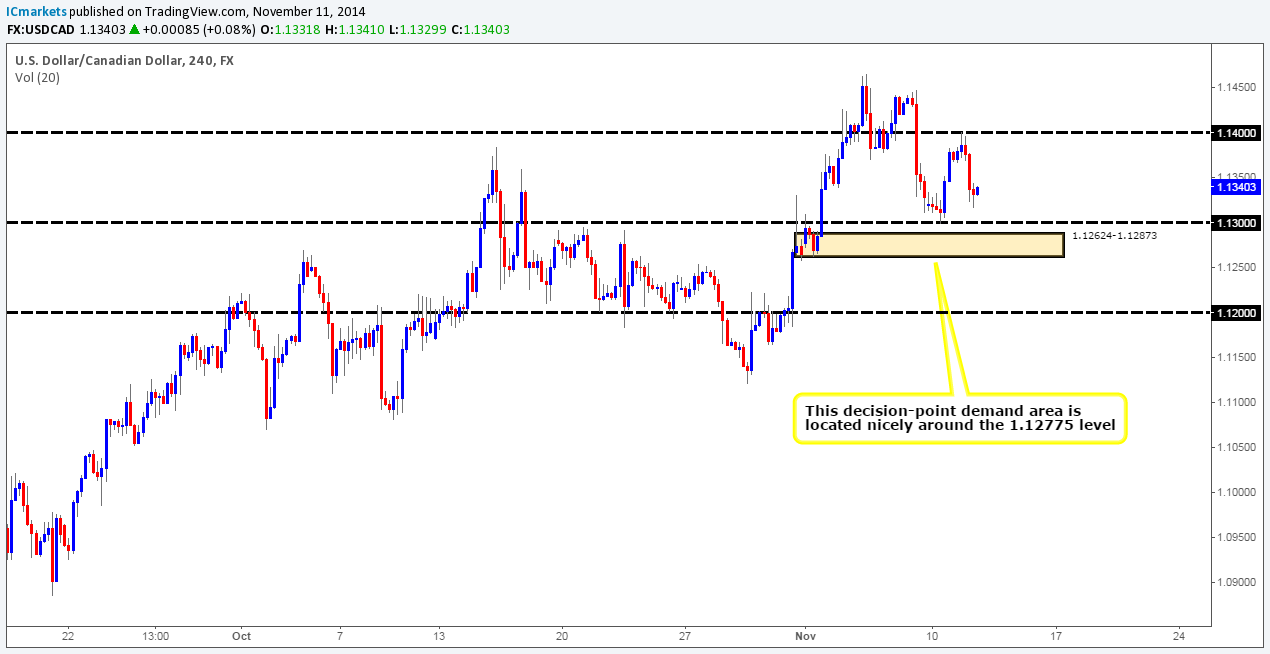
Weekly Timeframe: The weekly timeframe shows price is currently trading above the medium-term weekly high 1.12775. Ideally, it would be fantastic to see price retest this level as support, as it could provide a nice base to buy into this market targeting the weekly supply area seen above at 1.17225-1.15417.
Daily Timeframe: The daily timeframe on the other hand shows price is currently stalling just above 1.12775, which is not really a great sign for anyone wishing to buy off of this level, as we would effectively be buying into congested supply. Let’s see if we can find anything on the 4hr timeframe.
4hr Timeframe: The 4hr timeframe is far easier to interpret for the time being. Our attention is focused primarily on one area on the USD/CAD, and that is the 4hr decision-point demand area coming in at 1.12624-1.12873. We feel the risk is worth taking to place a pending buy order around 1.12916 simply because of the following things:
- The 4hr area is where pro money likely made the ‘decision’ to form new highs (1.14655) and ultimately close above 1.12775 (the medium-term weekly high). Therefore, this area may have unfilled buy orders still remaining.
- The 1.13 round-number level is begging to be faked. Think about this logically for a second. A beautiful reaction was seen off of this psychological level not too long ago on the 10/11/2014 at 1.12991, and a lot of traders will see this as confirmation that this level is strong, and they could well be right. However, we favor a break lower into the 4hr decision-point area, since stopping out a ton of buyers attempting to fade 1.13 will likely give pro money sell stops to buy into, and let’s not forget the breakout traders on the lower timeframes who will also be pumping sells into the market, unaware they’re actually selling into higher-timeframe demand.
The above is only one interpretation, so please do take it as such.
Buy/sell levels:
- Buy orders: 1.12916 (Predicative stop-loss orders seen at: 1.12534).
- Sell orders: N/A (Predicative stop-loss orders seen at: N/A).
USD/CHF:
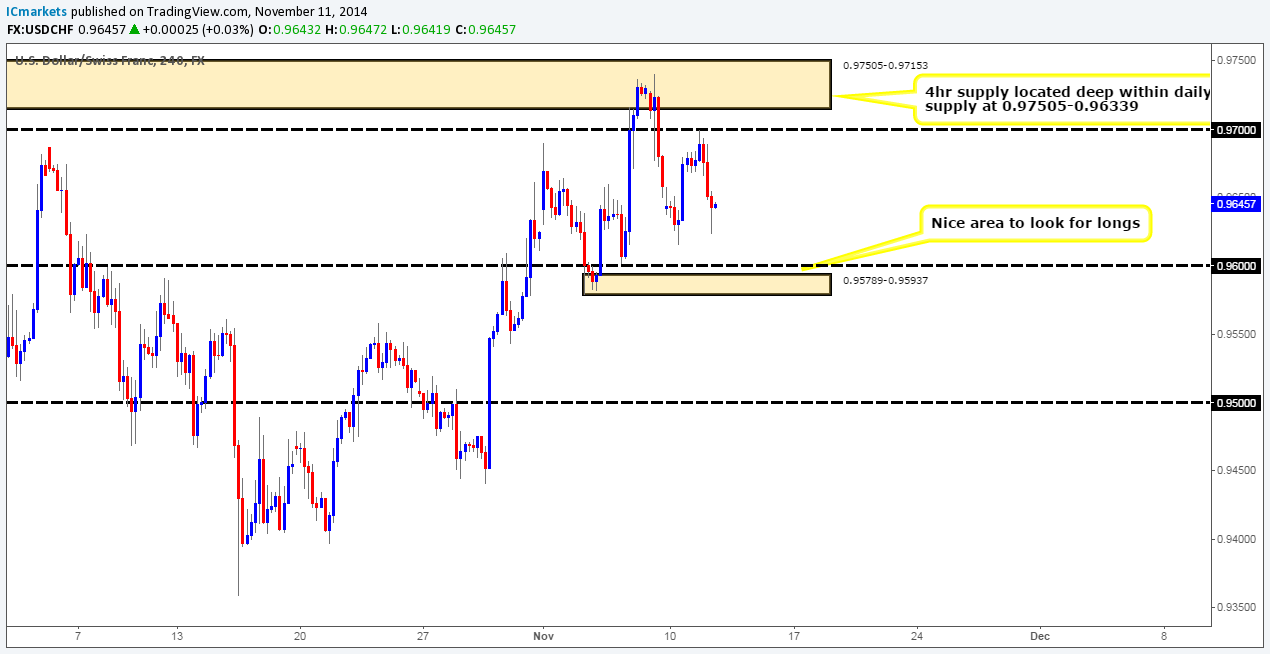
Weekly Timeframe: The weekly timeframe still shows price is capped between a weekly supply area coming in at 0.98378-0.95895, and a weekly resistance flip level seen at 0.94546.That being said though, most of the current trading action is taking place within the weekly supply area at the moment, so any buy trades initiated will require strict trade management rules.
Daily Timeframe: The main trading action on the daily timeframe is taking place deep within a major daily supply area seen at 0.97505-0.96339 (located within the aforementioned weekly supply area), where minor selling has been seen. Assuming this selling activity continues, we feel there is a good chance that prices could decline down to at least 0.95965, a small daily decision-point demand level. On the other hand, a breakout above the aforementioned daily supply area would likely mean prices are going to challenge the extremes of the aforementioned weekly supply area. Let’s see what the 4hr timeframe has to say about this.
4hr Timeframe: The 4hr timeframe shows that the 0.97 level was a great place to look for shorting opportunities. Nonetheless, the downward momentum seems to fading as buyers appear to be coming into the market around 0.96237 at the moment. The question we have to be asking ourselves here is will this buying interest last? In our humble opinion we believe it will not, simply because we feel price has further to go before any ‘real’ demand is hit. Serious buy orders are likely located around 0.95967; just above a fresh 4hr demand area at 0.95789-0.95937 (located around the daily decision-point demand level at 0.95965). We feel that the following levels 0.96155/0.96 are just fake levels designed to entice traders to buy so pro money can collect liquidity (sell stops) on their way down to this 4hr area.
Nevertheless, the above may well happen, but we would still not be confident enough to touch trade this area simply because larger sellers could possibly come into the market and break through this level, as we mustn’t forget that price is currently trading within higher timeframe supply at present (weekly: 0.98378-0.95895, daily: 0.97505-0.96339), so any buy trades initiated will have to be done so with caution on this timeframe.
Buy/sell levels:
- Buy orders: 0.95967 [Tentative] (Predicative stop-loss orders seen at: 0.95755).
- Sell orders: N/A (Predicative stop-loss orders seen at: N/A).
XAU/USD (GOLD):
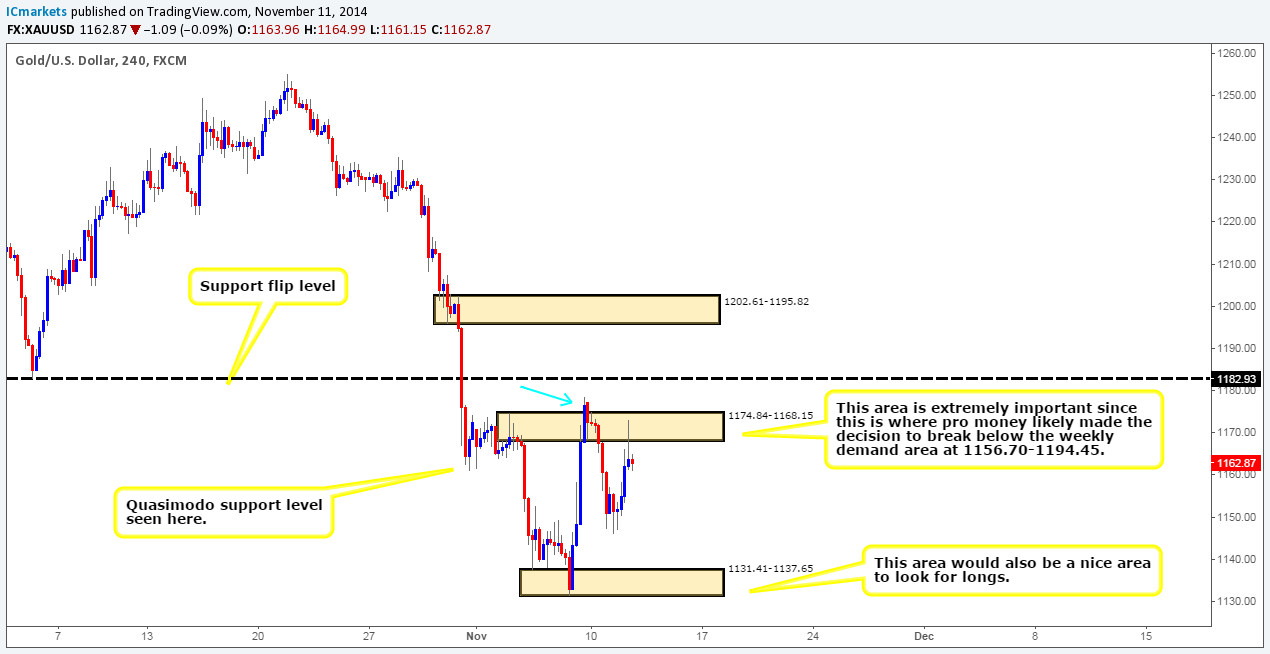
Weekly Timeframe: For anyone who bought based off of the bullish weekly pin-bar candle that broke through the weekly demand area at 1156.70-1194.45 last week will likely be in serious drawdown now. Let’s take a look on the lower timeframes to see what’s happening.
Daily Timeframe: For anyone who read Monday’s analysis of this pair, you would have likely resisted buying on the break of that weekly pin-bar candle, as it was reported that all price had effectively done was traded directly towards a major daily support flip level at 1182.01. For us to consider buying into this market, a positive close above 1182.01 would be required. Let’s take a look on the 4hr timeframe to see what the lower-timeframe picture looks like.
4hr Timeframe: The 4hr timeframe on the other hand is currently showing bullish price action.
Monday’s analysis reported that price had broken above a very important 4hr supply area at 1174.84-1168.15 seen marked with a blue arrow. The importance comes from this being an area where pro money likely made the ‘decision’ to break below the weekly demand area mentioned above at 1156.70-1194.45.
With the above taken into consideration, we see a potential bullish set up forming, here’s why:
- Sellers have been consumed around the aforementioned 4hr supply area, which effectively clears the path north to around a 4hr support flip level seen at 1182.93 (the daily timeframe shows this as a major support flip level – see above).
- Price has yet to hit the above 4hr support flip level, and this is how we want it to stay since it will be take-profit target.
- We believe that there are active buy orders are lurking around 1138.51, above a 4hr Quasimodo support area coming in at 1131.41-1137.65. This would be a perfect area to enter long targeting 1182.93 – just look at the potential risk to reward there if we took profit at 1182.93
This set up could take some time to unfold, but for the time being, this is all we’d risk our money on.
Buy/sell levels:
- Buy orders: 1138.51 (Predicative stop-loss orders seen at: 1130.21).
- Sell orders: N/A (Predicative stop-loss orders seen at: N/A).
Source:: Wednesday 12th November: Daily technical outlook and review.


