
Previous Story
Wednesday 13th May: Volatility is likely to be seen on the GBP today as BOE Gov. Carney takes the stage.

EUR/USD:
Weekly view: The weekly timeframe shows that the buyers and sellers continue to battle for position in between a weekly supply zone coming in at 1.1449-1.1278, and a weekly swap level seen at 1.1051. The past two months have been the most we’ve seen the Euro pair rally since price began its descent back in May 2014. In spite of this, our long-term bias still remains south and will continue to do so until we see a convincing push above the aforementioned weekly supply area.
Daily view: From the daily timeframe, we can see that price found support around the 1.1143 region yesterday. The reaction from here was relatively strong as price managed to close above Monday’s high 1.1204. It will be interesting to see what the 4hr timeframe has to say about this…
4hr view: Yesterday’s trading sessions saw the Euro rally from a 4hr Quasimodo support area at 1.1121-1.1140 (something we never spotted in our previous analysis). The move from here aggressively took out the round number 1.1200, and collided with a minor 4hr resistance level coming in at 1.1265, which, as you can see, was clearly enough to support a counterattack back down to retest the 1.1200 region.
Taking all of the above into account, today’s spotlight will be firmly focused on 1.1200. If the buyers are able to defend this number today, price may attack 1.1265 again which could provide us with a short-term buying opportunity if it’s accompanied with lower timeframe confirmation. Should this be seen, anyone who took short positions based on the daily Harmonic Bat reversal zone at 1.1516/1.1376 may want to consider moving stops to breakeven and possibly taking some profits.
On the other hand, a break below 1.1200 could open the gates for prices to challenge the 4hr Quasimodo area mentioned above at 1.1121-1.1140. We, however, would be cautious to sell on the break of this number simply because of the relatively strong move seen from daily support (1.1143) yesterday.
Levels to watch/live orders:
- Buys: 1.1200 [Tentative – confirmation required] (Predicative stop-loss orders seen at: dependent on where one confirms this level).
- Sells: Flat (Predicative stop-loss orders seen at: N/A).
GBP/USD:
Weekly view: Recent events on the weekly timeframe show that price has broken above weekly supply at 1.5551-1.5391, forcing the GBP to collide with another weekly supply area seen just above it at 1.5784-1.5620. The past month has been the most we’ve seen Cable rally since price began to sharply sell off back in mid-July 2014. Despite this, our long-term bias will remain short on this pair until a convincing close above the weekly supply area 1.5784-1.5620 is seen.
Daily view: From this angle, we can see that cable rallied for a third consecutive day yesterday. This move caused price to close above the daily swap zone seen at 1.5619-1.5567, likely setting the stage for a continuation move north towards a major daily swap level coming in at 1.5740 (positioned very deep within the weekly supply area mentioned above at 1.5784-1.5620).
4hr view: Once the European/London traders got to their desks; we can see that the pound was heavily bought into, consequently taking out 1.5600, and colliding with 1.5700, which for the time being seems to be holding.
From the higher-timeframe picture, it appears that price may want to trade higher, before we see any significant reversal (see above). Be that as it may, buying into round-number resistance 1.5700 would not be something our team would label a high-probability move. Ultimately though, what we’re looking for today is a retracement back down to the 1.5600 number, or even the 4hr demand sitting below it at 1.5556-1.5580, this would give us a nice opportunity to begin looking for a confirmed long entry into the market. Don’t forget that by buying from around this region, you’d also have the added support of the daily swap area mentioned above at 1.5619-1.5567.
If price fails to retrace this far, however, and we see a push above 1.5700, then there will be very little room to play with, since the daily swap level at 1.5740 sits only 40 pips above this psychological level.
Levels to watch/ live orders:
- Buys: 1.5600/1.5556 region [Tentative – confirmation required] (Predicative stop-loss orders seen at: dependent on where one confirms this area, but will likely be placed at 1.5545)
- Sells: Flat (Predicative stop-loss orders seen at: N/A).
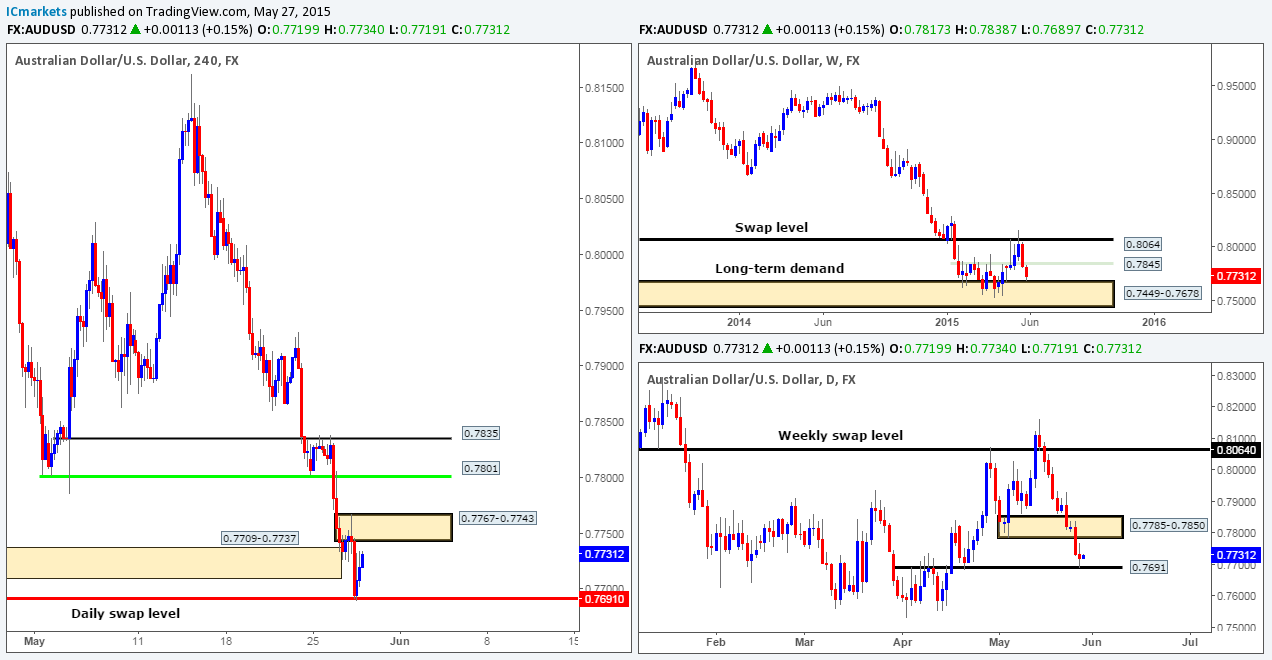
AUD/USD:
Weekly view: Following the close above the weekly swap level 0.7845, the buyers remain strong. In the event that this continues, the weekly swap level 0.8064 will once again likely be in the spotlight.
Daily view: From this angle, we can see that price is currently trading very close to daily supply seen at 0.8074-0.8006, which is located just below the aforementioned weekly swap level.
4hr view: 4hr demand seen at 0.7859-0.7899 held strong throughout yesterday’s sessions. Price rallied a cool 100 pips from this area, missing the large psychological number 0.8000 by a pip! The 0.8000 number, as you can see was defended, which forced price to retest the mid-level number 0.7950. At the time of writing, price is trading mid-way between these two numbers. Attempting to trade at this level is considered mid-range in our book. We intend to keep a close eye on both of these barriers today. Short-term trades could be a possibility from either of these levels. However, do bear in mind that fakeouts are a common occurrence around round numbers, so waiting for the lower timeframes to confirm strength before committing capital, is in our opinion, the best path to take here.
Nonetheless, in the event that a cut through and retest of the 0.8000 level is seen today, this would, in effect, be our cue to begin watching for lower timeframe strength to come into the market for a possible buy up to the combined 4hr/weekly swap area coming in at 0.8048/0.8064. Once or indeed if price reaches this area, this is where we would exit our longs and begin looking for confirmed shorts into this market.
On the flip side, should we see a break below and retest of 0.7950 today, we would then begin looking for lower timeframe resistance to hold firm and stabilize prices for a potential short entry, targeting the 4hr demand area mentioned above at 0.7859-0.7899.
Levels to watch/ live orders:
- Buys: 0.7950 [Tentative – confirmation required] (Predicative stop-loss orders seen at: dependent on where one confirms this level).
- Sells: 0.8000 [Tentative – confirmation required] (Predicative stop-loss orders seen at: dependent on where one confirms this level).
USD/JPY:
Weekly view: For nearly two months the weekly timeframe has barely seen any change. The buyers and sellers continue to battle for position within the weekly demand area coming in at 118.22-119.40. Our long-term bias will remain north on this pair as long as price continues to trade above the weekly swap level seen below this area at 115.50.
Daily view: From the daily scale, we can see that a clear consolidation zone has been chiseled out within the aforementioned weekly demand area between daily support seen at 118.62 (located deep within the aforementioned weekly demand area), and a daily Quasimodo resistance level coming in at 120.35. Recent movement, however, has placed price within a stone’s throw away from the upper limit of this daily range, so for any traders considering buying right now, may want to take a note of this. It will be interesting to see what the 4hr timeframe has to say…
4hr view: In the midst of yesterday’s sessions, price continued to rally from the retest of 120.00. Following this, the market hit and rebounded just beautifully from the 4hr Quasimodo resistance level at 120.27. This number, alongside the daily Quasimodo resistance level 120.35 seen just above it was where we reported a reversal would likely take place. We do hope some of our readers locked in some green pips from this move! The follow-through from the 4hr Quasimodo resistance level saw the USD/JPY pair close below 120.00, which is, at the time of writing being retested as resistance. In the event that this number holds today, it’s likely we’ll see the market clash with a 4hr demand area seen at 119.74-119.58.
Given the points made above, we do not see any immediate opportunity to trade at present. Traders who are still short from the aforementioned 4hr Quasimodo level may want to move their stops to breakeven now and look to take partial profits if price reaches the 4hr demand area seen below at 119.74-119.58.

Levels to watch/ live orders:
- Buys: Flat (Predicative stop-loss orders seen at: N/A).
- Sells: Flat (Predicative stop-loss orders seen at: N/A).
USD/CAD:
Weekly view: From this angle, we can see that the weekly swap area coming in at 1.2034-1.1870 appears to be struggling to hold the market at the moment. In the event that this area gives way, the path south will then likely be free for the sellers to challenge weekly demand seen at 1.1547-1.1672.
Daily view: Supportive pressure is clearly being seen from the daily demand area at 1.1931-1.2045. This should not really come as much of a surprise though, as this zone is not only located nicely within the aforementioned weekly swap area, but also converges just beautifully with a Harmonic Bat support zone completing just below it at 1.1921. However, with all of this support in the market, price has failed on two occasions to convincingly close above the mid-level number 1.1250.
4hr view: In the thick of yesterday’s sessions, the USD/CAD pair nosedived over a 100 pips. It was only once price reached the large round number area 1.2000 did we see any buying interest …
Buying from 1.2000, however, is not really something our team would be comfortable doing, due to the fact that we have potential 4hr resistance looming just above at 1.2034-1.2048, and also let’s not forget that there’s a lot of weakness being seen on the higher timeframes at the moment (see above). Ultimately, at this point in time, we would not be confident buying this market until a close above the 4hr downtrend line (1.2304) takes place.
Selling this pair on the other hand, will only be permitted once, or indeed if, a close is seen below the 4hr demand area at 1.1931-1.1960 (located deep within the aforementioned daily demand area).

Levels to watch/live orders:
- Buys: Flat (Predicative stop-loss orders seen at: N/A).
- Sells: Flat (Predicative stop-loss orders seen at: N/A).
USD/CHF:
Weekly view: Last week’s action shows that there was an aggressive break below the weekly demand area seen at 0.9170-0.9343, which as you can see, came very near to crossing swords with the weekly swap level 0.9018. Provided that the buyers can continue with this tempo, it is possible we may see price challenge the recently broken weekly support, now resistance at 0.9512.
Daily view: The recently-closed daily candle reveals that selling interest came into the market yesterday from just within daily supply seen at 0.9411-0.9336. This consequently pushed price down to test the upper limits of the daily demand area at 0.9155-0.9206.
4hr view: From the 4hr scale, we can see that the recent sell off took out 0.9300, and slammed into 4hr demand coming in at 0.9190-0.9235, which as you can see, was clearly strong enough to promote a counterattack back up to retest the lower limits of 0.9300.
With the above in mind, the 0.9300 number could be worth keeping an eye on today. In the event that we spot lower timeframe selling strength here, we’ll look to short price back down to the aforementioned 4hr demand area. If 0.9300 is taken out and respected as support, however, one can likely expect a continuation move to be seen up to the mid-level number 0.9350. We would only consider entering long here if on the retest lower timeframe confirmation was seen, since let’s not forget that we are trading only a few pips below the aforementioned daily supply area at the moment.

Levels to watch/ live orders:
- Buys: Flat (Predicative stop-loss orders seen at: N/A).
- Sells: 0.9300 [Tentative – confirmation required] (Predicative stop-loss orders seen at: dependent on where one confirms this level).
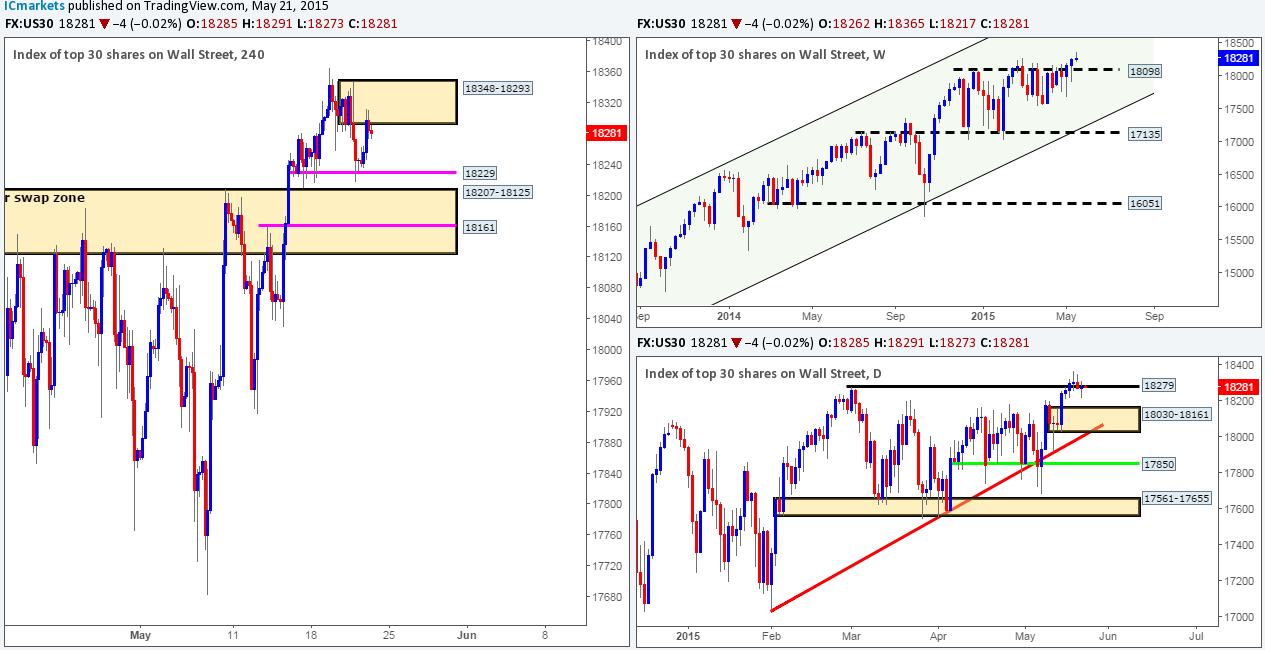
US 30:
Weekly view: Last week’s action shows that price closed (18177) above the four-month long resistance barrier at 18098. In order for us to be convinced that this was indeed a genuine close higher, our team will need to see the buyers maintain a strong position above this number during the week.
Daily view: From this angle, we can see that price continues to range between daily support at 17850, and daily supply coming in at 18207-18117. Recent action shows that the upper limit of this range repelled the market yesterday, forcing price to test the daily trendline extended from the low 17033.
4hr view: Technically, there has been very little change since we last analyzed this index.
At the time of writing, the 4hr chart is in a clear phase of consolidation. The limits of this 4hr range (upper: 18207-18125 [located deep within the aforementioned daily supply area] lower: 17741-17850 [located just below the aforementioned daily support]) are clearly very responsive, since each time price visits one extreme, it ends with the market testing its opposing limit.
Our team has come to a general consensus that trading within this 4hr range is high probability at the moment. However, we have no plans to enter into any trade within this consolidation without confirming price action from the lower timeframes. The reason for why comes from the recent weekly close above a relatively important weekly resistance barrier last week (see above). With that, we feel that a close above this range is more likely to be seen than a close lower. Only time will tell though…
Levels to watch/live orders:
- Buys: 17741-17850 [Tentative – confirmation required] (Predicative stop-loss orders seen at: dependent on where one confirms this area).
- Sells: 18207-18125 [Tentative – confirmation required] (Predicative stop-loss orders seen at: dependent on where one confirms this area).
XAU/USD (Gold)
Weekly view: From a weekly standpoint, the trend on Gold is still firmly south, and will remain that way in our opinion until price closes above the weekly trendline extended from the high 1488.0. At the time of writing, however, price appears to have somewhat stagnated in between weekly supply seen at 1223.1-1202.6 and a weekly demand area coming in at 1130.1-1168.6.
Daily view: From the daily scale, we can see that daily support at 1178.3 continues to hold firm. Nevertheless, we still believe this level to be weak – check out how each time price visits this level, there is no subsequent higher high seen, which in itself could suggest buying weakness. A close below this daily barrier would not be the end of the world for the buyers mind you, since daily demand at 1159.4-1170.8 (located just within the aforementioned weekly demand area) lurks just below to save the day.
4hr view: The Gold markets went insane once London opened for business yesterday. Price rallied a very cool 1048 pips in one big swoop of buying activity. This move consequently forced price to take out 1192.7 and shake hands with a 4hr supply area seen at 1197.4-1195.3, which as you can see, is currently holding this market lower. Selling from this 4hr area of supply is considered a risky trade in our book due to potential support looming just below around the recently broken 4hr level 1192.7. A more conservative approach (in our opinion) to shorting here would be to wait for prices to close below and retest 1192.7 before considering a sell trade. The close lower will likely free the path south for a move back down towards the small 4hr demand area seen at 1177.6-1178.6 (surrounds the daily support level 1178.3). The reason for why we believe price could drop thus far comes from the initial reaction seen at the 4hr supply area 1197.4-1195.3. Take a look how price aggressively spiked south upon hitting this 4hr supply, piercing the 1189.8 4hr swap level marked in green, which likely cleared out any demand around this number, thus allowing price to freely pass through should we see a sell off today.

Levels to watch/live orders:
- Buys: Flat (Predicative stop-loss orders seen at: N/A).
- Sells: Flat (Predicative stop-loss orders seen at: N/A).
The post Wednesday 13th May: Volatility is likely to be seen on the GBP today as BOE Gov. Carney takes the stage. appeared first on .


