Previous Story
Wednesday 25th March: Daily technical outlook and review.

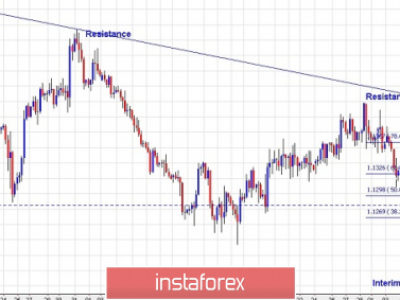
EUR/USD:
Weekly timeframe perspective: Last week saw the Euro form a bullish engulfing candle a few pips from above the long-term weekly swap level coming in at 1.0411. In the event that this attracts further buyers into the market, price will very likely be drawn to the weekly swap level seen at 1.1109.
Daily timeframe perspective: Willing sellers were clearly waiting around last week’s high at 1.1036 yesterday, which, as you can see, caused the market to sell off. In order for price to reach the weekly swap level mentioned above at 1.1109, a clean break above this number is needed.
4hr timeframe perspective: The latest coming in from the 4hr chart shows that price beautifully retested 1.0900 as support , which then saw a prompt rally north faking above the 1.1000 level into 4hr supply at 1.1050-1.1011. This move consequently forced the market southbound back down towards the 1.0900 region.
Assuming that the buyers can hold out above 1.0900 today, there may be another buying opportunity (if lower timeframe confirmation is seen) back up to 1.1000, and potentially, with enough effort from the buyers, the weekly swap level seen above in red at 1.1109.
A decisive push below 1.0900 on the other hand, would likely see price test the highs 1.0881 as support, and then potentially retest 1.0900 as resistance (selling opportunity here). At which point, we would expect price to drop and test the 4hr demand coming in at 1.0766-1.0826, which could, on its own, provide a fantastic base to buy from since it’s located around a daily swap level seen at 1.0825.
Current buy/sell orders:
- Buy orders: watching for buying strength around 1.0900 (Predicative stop-loss orders seen at: dependent on where one confirms this level).
- Sell orders: Flat (Predicative stop-loss orders seen at: N/A).
GBP/USD:
Weekly timeframe perspective: The current situation on the weekly chart shows price lingering just below a weekly Quasimodo resistance (prior support) level seen at 1.5007. Further downside from here could see price drop as far as the major weekly demand area coming in at 1.4225-1.4482.
Daily timeframe perspective: From here, we can see that price is currently trading between a daily decision-point supply area seen at 1.5136-1.5020, and a daily demand area coming in at 1.4686-1.4805.
4hr timeframe perspective: As far as we can see on the 4hr timeframe, the GBP is temporarily range bound between 1.4969/1.4845, and surrounding this consolidation are two very prominent psychological numbers (1.500/1.4800). Buying and selling within this range is valid in our opinion (tentative buys seen at 1.4853, and sells at 1.4964); as long as one waits for some sort of confirmation signal from the lower timeframes before risking money, since fakeouts are so very common in environments such as this.
Given that the weekly chart is showing somewhat resistive qualities at the moment (see above), and that the overall trend is indeed pointing south, we feel a breakout south of this range will eventually be seen. This move would see price hit 1.4800, which could be a level to watch for intraday buys.
Current buy/sell orders:
- Buy orders: 1.4853 [Tentative – confirmation required] (Predicative stop-loss orders are seen at: dependent on where one confirms this level) 1.4800 [Tentative – confirmation required] (Predicative stop-loss orders are seen at: dependent on where one confirms this level).
- Sell orders: 1.4964 [Tentative – confirmation required] (Predicative stop-loss orders are seen at: dependent on where one confirms this level).
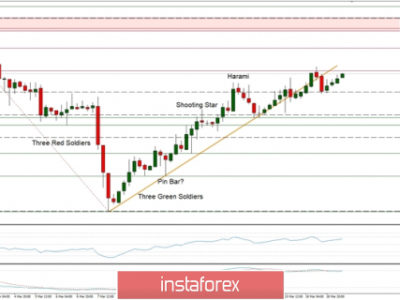
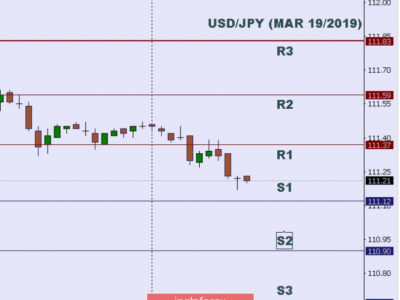
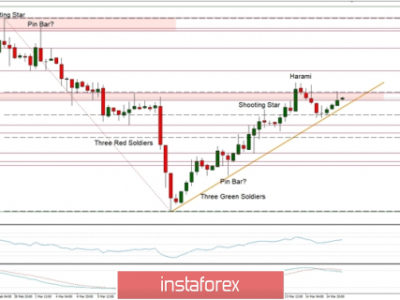
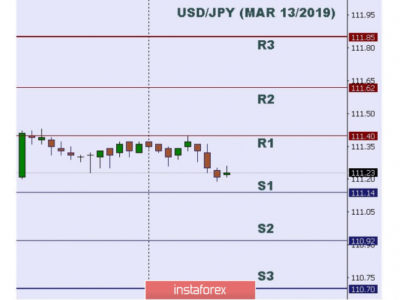
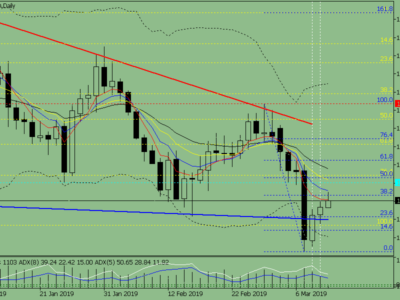
USD/JPY:
Weekly timeframe perspective: At the time of writing, price is seen teasing a minor weekly decision-point demand area coming in at 118.22-119.40. If price can hold out above this zone, we then feel there’s a very good chance that the buyers will attack the weekly Quasimodo resistance level seen above at 122.18.
Daily timeframe perspective: From this angle, we can see that price recently closed below a small daily demand area coming in at 119.37-119.81. This move has likely cleared the runway south for further selling down to yet another very small daily demand area seen at 118.61-119.05, which, if you look back to the weekly chart, you’ll notice is located relatively deep within the aforementioned minor weekly decision-point demand area.
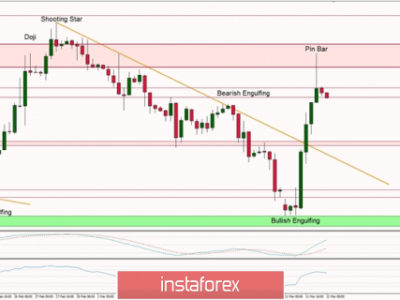
4hr timeframe perspective: Yesterday’s sessions saw the market eventually sell off from the 119.74 barrier. This move consequently broke below the 4hr trendline support (116.86), and hit a 4hr demand area at 119.06-119.27, which, as you can see, was clearly enough to support a counterattack back up to 119.74. We hope some of our readers took advantage of this move as it was a highlighted as an area of importance in our previous report.
Taking all of the above into consideration, we’re not overly concerned by what the daily timeframe is telling us at the moment, since the aforementioned 4hr demand area is defending any move lower for the time being. Therefore, today’s spotlight will be firmly focused on both 119.74 and 120.00. In between these two numbers, we see very little active supply – take note of the very prominent supply consumption wicks seen at: 119.89/119.88/119.86, so price should, upon breaking above 119.74, be effectively free to hit 120.00.
Ultimately, the team is looking for price to close above 120.00 as this would open up a whole new void for profit up to the 121.00 region, and possibly higher, since let’s not forget that we are trading around weekly demand at the moment (see above).

Current buy/sell orders:
- Buy orders: Flat (Predicative stop-loss orders seen at: N/A).
- Sell orders: Flat (Predicative stop-loss orders seen at: N/A).
USD/CAD:
Weekly timeframe perspective: From last week’s action, we can see that the USD/CAD pair formed a nice-looking bearish engulfing candle around the underside of a weekly Quasimodo resistance level at 1.2765. Should further selling be seen from this point, we may see price attack the weekly swap level coming in at 1.2260.
Daily timeframe perspective: The buyers and sellers still remain battling for position within a daily demand area at 1.2405-1.2517, which, in our opinion, remains a key obstacle to a move towards the weekly swap level mentioned above at 1.2260.
4hr timeframe perspective: The USD/CAD pair sold off in yesterday’s sessions, completely taking out 1.2500, and driving deep into 4hr demand at 1.2423-1.2480 (located within the aforementioned daily demand area).
Given that we are bearish on the weekly chart and bullish on the daily scale (see above) at the moment, where does this leave traders on the 4hr timeframe? Well, one could, as mentioned in the previous report, buy from the 4hr demand mentioned above, but with potential resistances being seen at 1.2500 and 1.2530, we’re reluctant to commit at this time.
With regards to selling this pair, our team has come to the conclusion that a close below current 4hr demand would be needed beforehand, as this will likely suggest to us that most of the major buyers within the daily demand area mentioned above are consumed.

Current buy/sell orders:
- Buy orders: Flat (Predicative stop-loss orders seen at: N/A).
- Sell orders: Flat (Predicative stop-loss orders seen at: N/A).
USD/CHF:
Weekly timeframe perspective: At this point in time, we can see that price has clearly penetrated a weekly swap (support) level coming in at 0.9663. In the event that the sellers can continue with this tempo, it is likely we’ll see the Swiss pair hit another weekly swap (support) level seen at 0.9382.
Daily timeframe perspective: The daily timeframe on the other hand shows that in order for further selling to be seen on the weekly timeframe, the sellers will need to firstly take out a strong-looking daily demand area positioned at 0.9449-0.9534, where, at the time of writing, supportive pressure is being seen.
4hr timeframe perspective: The current status on the 4hr timeframe shows price trading between a minor 4hr swap level seen at 0.9541 (located just above the aforementioned daily demand area), and the round number 0.9600.
A break above 0.9600 would likely force the market north at least until 4hr supply at 0.9693-0.9666. This area will likely contain strong selling opposition for the simple reason that this is where pro money potentially made the decision to push below the weekly swap level at 0.9663.Therefore, if a break above and retest of 0.9600 is seen today, and we buy, our position will be closed at this area of 4hr supply.
A break below 0.9541 on the other hand, will simply mean price is digging deeper into the aforementioned daily demand area. Selling this break is not something our team would be comfortable with, even with the weekly timeframe indicating further downside could be in store. Selling, for the time being, will only be permitted once price closes below daily demand just mentioned.

Current buy/sell orders:
- Buy orders: Flat (Predicative stop-loss orders seen at: N/A).
- Sell orders: Flat (Predicative stop-loss orders seen at: N/A).
DOW 30:
Weekly timeframe perspective: From this angle, the overall trend remains very strong in our opinion; however, we can see that the buyers and sellers are currently pulling for position around the 18098 resistance. A convincing push above here will be needed in order for this trend to continue.
Daily timeframe perspective: Downward pressure has been seen from a small fresh pocket of daily supply at 18279-18192. Assuming that the sellers can continue with this tempo, we see very little support coming into the market until price reaches the daily decision-point demand area at 17561-17655. It will be interesting to see what the 4hr timeframe makes of all this…
4hr timeframe perspective: Overall, the structure of price has not really seen much of a change since the previous report. The push above 4hr supply at 18164-18111 has, in our opinion, likely cleared the path north for the market to test a 4hr Quasimodo resistance level coming in at 18241 (located deep within the aforementioned daily supply area). To take advantage of this potential up move, one could either buy at market, effectively buying the breakout, or, as shown by the red arrows, wait for price to drop down towards the origin 17871-17945 (buy orders seen just above at 17957). Due to our conservative trading nature, we definitely favor the latter!
Now, at this point, you may be thinking that by buying here you would essentially be going against sellers from both weekly and daily levels. That is true and this trade could very well turn out to be a loser. However, what gives us confidence is the fact that the overall weekly trend is FIRMLY pointing north, and, in addition to this, we have clear direction on the 4hr timeframe (for levels see above). Therefore, our bias for the time being remains long.

Current buy/sell orders:
- Buy orders: 17957 (Predicative stop-loss orders seen at: 17859).
- Sell orders: Flat (Predicative stop-loss orders seen at: N/A).
XAU/USD (Gold):
Weekly timeframe perspective: Following the bullish engulfing candle that formed last week just above the weekly decision-point demand level at 1136.3, further buying is currently being seen. If this continues, it is likely price will collide with a weekly decision-point supply area coming in at 1223.1-1202.6.
Daily timeframe perspective: From this timeframe, we can see that the buyers have broken above the 1188.3 daily barrier, which has, as far as we can see, likely paved the way north for a move towards daily supply seen at 1223.1-1213.0 (located deep within the aforementioned weekly supply area).
4hr timeframe perspective: The 4hr timeframe shows that Gold recently closed above and retested 1188.3 as support, which, if you read through our last analysis, you may remember us reporting this was something to keep a close eye on. Unfortunately, we have yet been able to find a suitable entry long from this level. For anyone who did manage to buy from here, however, we see further upside to this pair at least until 4hr supply at 1200.5-1196.4, and potentially the 4hr Quasimodo resistance level at 1205.8, where at which point, the market will be trading within the aforementioned weekly decision-point supply zone, so do pay close attention to your long positions around this hurdle.

Current buy/sell orders:
- Buy orders: Flat (Predicative stop-loss orders seen at: N/A).
- Sell orders: Flat (Predicative stop-loss orders seen at: N/A).
The post Wednesday 25th March: Daily technical outlook and review. appeared first on .
Source:: Wednesday 25th March: Daily technical outlook and review.