Previous Story
Wednesday 29th April: Daily technical outlook and review.

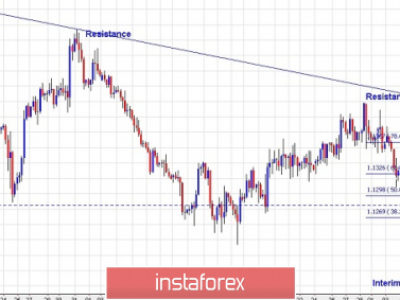
EURUSD:
Weekly view: The weekly timeframe still shows that the Euro is trending south, and has been for nearly a year now. A convincing push above weekly supply at 1.1449-1.1278 would be needed to invalidate our current bearish bias. In the event that the Euro continues to be bought, we might, just might, see prices challenge the weekly swap level at 1.1096.
Daily view: From this angle, we can see that yesterday’s price action drove itself deep into the daily resistance zone at 1.1051-1.0918. This area, as you can probably see, remains a key obstacle to a move towards the aforementioned weekly swap level.
4hr view: After price met strong support at the 1.0860 mark, the Euro took no prisoners, rallying over 100 pips into yesterday’s close. This move took out 1.0900 and is now seen teasing the extremes (the 4hr AB=CD completion point at 1.0985) of our Gartley pattern that we’ve been talking about over the last couple of days.
Given that this pair is currently trading within a proven resistance zone on the daily scale (see above) at the moment, the focal point for today will be looking for lower timeframe confirmed shorts around the aforementioned 4hr AB=CD completion point. However, looming just above this completion point is a large psychological number 1.1000 and an extreme 4hr supply zone at 1.1034-1.0992; therefore we could potentially see a spike north before any type of reversal is seen. Supposing that we manage to find a lower timeframe entry around the AB=CD point, our team have already penciled in 1.0900 as a logical first take-profit target as per the red arrow.
The reason for us requiring lower timeframe confirmation at our 4hr AB=CD completion point is because there is supportive pressure being seen on the weekly timeframe (see above) – better to be safe than sorry!
Current buy/sell orders:
- Buy orders: Flat (Predicative stop-loss orders seen at: N/A).
- Sell orders: 1.0985 region [Tentative – confirmation required] (Predicative stop-loss orders seen at: depends on where one confirms this area).
GBP/USD:
Weekly view: The weekly timeframe shows that the GBP/USD is on fire at the moment. Assuming that the buyers can continue with this tempo, there’s a good chance price will challenge the weekly supply area coming in at 1.5551-1.5391 very soon.
Daily view: Yesterday’s daily bull candle closed above the daily swap area seen at 1.5298-1.5208. The engulf of this zone could be a sign that prices want to test the daily Quasimodo resistance level seen at 1.5478 (located within the aforementioned weekly supply area).
4hr view: The recent advance on this pair saw price take out the 1.5300 handle and also close just above a proven 4hr swap level coming in at 1.5330 (located a little way below the aforementioned weekly supply area), potentially clearing the path north towards 4hr supply seen at 1.5396-1.5367. This – coupled with the weekly and daily timeframes suggesting that the pound still has room to move north (see above for levels), our attention will be mostly driven towards buying today.
However, a drop in value may take place before prices can rally, since the GBP is currently testing the completion point of a 4hr AB=CD bearish pattern around the 1.5339 mark at the moment. How far prices could fall is hard to tell. The most logical zones to look for buys, in our opinion, are the following two areas (lower timeframe confirmation will be required at each area):
- The round number 1.5300.
- The 4hr demand area at 1.5175-1.5232.
Current buy/sell orders:
- Buy orders: 1.5300 area [Tentative – confirmation required] (Predicative stop-loss orders seen at: dependent on where one confirms this level) 1.5175-1.5232 [Tentative – confirmation required] (Predicative stop-loss orders seen at: 1.5168).
- Sell orders: Flat (Predicative stop-loss orders seen at: N/A).
AUD/USD:
Weekly view: From the weekly timeframe, we can see that the buyers finally gained consciousness. The Aussie Dollar was bought heavily, placing price within just a stone’s throw away from the weekly swap level 0.8064
Daily view: Yesterday’s daily bull candle rallied from open to close a cool 165 pips, resulting in price taking out the daily range upper limit coming in at 0.7875, and subsequently clearing a path north towards the aforementioned weekly swap level.
4hr view: The Aussie’s recent advance took out several 4hr technical levels, and is, at the time of writing, teasing the upper limits of a 4hr supply area seen at 0.8024-0.7995.
Considering the market’s overall position on the higher timeframes at the moment (see above), our team has come to a general consensus that longs will be our primary focus for today. But as things stand, buying at current prices would effectively mean buying the breakout of the aforementioned 4hr supply area, which is something we tend to avoid. Breakout trading works for some, just not for us. Therefore, we’ve decided to wait and see if prices can retest the large psychological barrier seen below at 0.8000 as support today. In the event that a successful retest takes place and lower timeframe buying strength is present, our team plans to enter long here targeting the 0.8048/0.8064 area (4hr swap level at 0.8048/weekly swap level at 0.8064) as per the red arrows.

Current buy/sell orders:
- Buy orders: 0.8000 area [Tentative – confirmation required] (Predicative stop-loss orders seen at: dependent on where one confirms this level).
- Sell orders: Flat (Predicative stop-loss orders seen at: N/A).
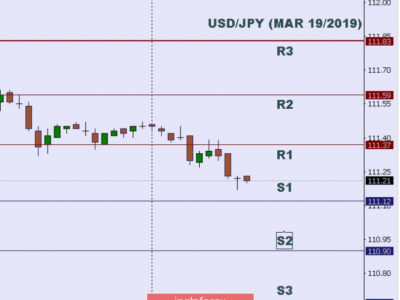
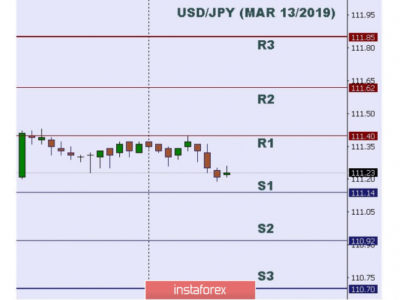
USD/JPY:
Weekly view: For the past month or so, the buyers and sellers have been seen battling for position within a weekly demand area coming in at 118.22-119.40. Our bias will remain north on this pair as long as price continues to trade above 115.50.
Daily view: From the daily scale, we can see that price is resting on top of a daily trendline extended from the low 115.55, which, as you can probably see, also boasts additional supportive confluence from daily support coming in just below it at 118.62 (located deep within the aforementioned weekly demand area).
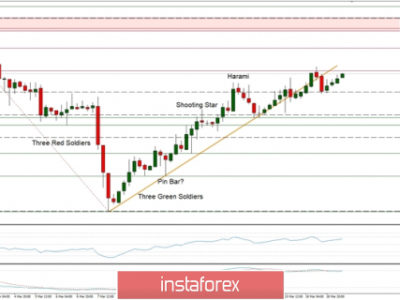
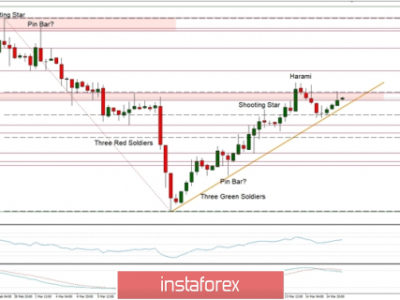
4hr view: The price action on the 4hr scale is very interesting. Currently, we’re seeing price retesting an already proven Harmonic bullish Gartley reversal zone marked in yellow at 118.85/118.67. What’s interesting, however, is that a near-perfect Harmonic bullish Butterfly pattern (thick black lines) is also on the brink of completing. With that, one can clearly see that the potential reversal zone for this pattern in green (118.67/118.58) is positioned perfectly around the aforementioned daily support level/trendline, making it an area of extreme confluence in our opinion.
Our team has no plans to enter at either harmonic zone at market prices; we’re going to let price action decide on the best route to take. If we spot confirming price action on the lower timeframes in either reversal area, we’ll confidently enter long. Take-profit targets will be dependent on how price behaves within and on the approach to a zone.

Current buy/sell orders:
- Buy orders: 118.87/118.52 [Tentative – confirmation required] (Predicative stop-loss orders seen at: Ideally below 118.52) 118.67/118.58 [Tentative – confirmation required] (Predicative stop-loss orders seen at: Ideally below 118.52).
- Sell orders: Flat (Predicative stop-loss orders seen at: N/A).
USD/CAD:
Weekly view: Following the weekly indecision candle that printed last week within the weekly swap area at 1.2265-1.2092, selling is currently being seen on the weekly timeframe. Should we see prices close below this weekly swap area at the end of the week, the path south will then likely be clear towards a weekly swap level seen at 1.1814.
Daily view: Following the close below the daily swap level coming in at 1.2086 (located just below the weekly swap area mentioned above), follow-through selling was seen yesterday, which as a result forced prices into a daily demand area seen at 1.1931-1.2045.
4hr view: The USD/CAD’s recent descent saw prices attack and slightly rebound from a 4hr swap level seen at 1.2014. Given that this level sits neatly within a daily demand area mentioned above at 1.1931-1.2045, it is likely further buying could take place from here. However, with the large psychological number 1.2000 looming just below this level, a fake lower could well be in store before any serious buyers come into the market.
Whether you decide to look for buys at the 1.2014 zone today, or below at 1.2000, we’d recommend waiting for some sort of confirmation pattern to form on the lower timeframes before committing capital to this idea, for the simple reason that the weekly scale is currently suggesting we may see a continuation move to the downside.

Current buy/sell orders:
- Buy orders: 1.2014 [Tentative – confirmation required] (Predicative stop-loss orders seen at: dependent on where one confirms this level) 1.2000 [Tentative – confirmation required] (Predicative stop-loss orders seen at: dependent on where one confirms this level).
- Sell orders: Flat (Predicative stop-loss orders seen at: N/A).
USD/CHF:
Weekly view: Overall, the weekly timeframe shows that the buyers are still managing to hold the market above support formed at 0.9512. Should a convincing close below this number be seen this week, this will very likely free the path south down towards a weekly demand area seen at 0.9170-0.9343.
Daily view: The daily timeframe shows that a consolidation zone is currently being chiseled out on top of the aforementioned weekly support level. Upper limits are seen in the form of a daily supply area at 0.9904-0.9771; the lower limits represent a daily demand area coming in at 0.9449-0.9545. The recent selling has, as you can see, placed price action firmly within the lower limits of this daily range, so for anyone considering shorting this pair today, you may want to take a note of this.
4hr view: The USD/CHF pair has seen very little change since we last analyzed its movements. Therefore most of the following will be repeated from the previous report:
Considering the market’s overall position on the higher timeframes at the moment (see above), longs would be more favorable in our opinion. However, buying at current prices would mean buying into the 4hr Quasimodo resistance level mentioned above, which is something we’d feel uncomfortable taking part in. For us to be convinced that there’s adequate room for prices to move north, we’d need to see a close above the 0.9600 handle, as the path north appears free from there up to at least 0.9700. With regards to selling this market, one could still look to scalp a small position from the aforementioned 4hr Quasimodo resistance level if price reaches this high today, but from a higher-timeframe standpoint this would be considered a high-risk trade in our book.
Therefore, with everything taking into consideration, opting to stand on the sidelines here may very well be the best position to take.

Current buy/sell orders:
- Buy orders: Flat (Predicative stop-loss orders seen at: N/A).
- Sell orders: Flat (Predicative stop-loss orders seen at: N/A).
US 30:
Weekly view: Although the overall trend has been strong since early 2009, a temporary ‘ceiling’ to this index has formed around the 18098 region, and has remained strong for an impressive four months!
Daily view: The buyers and sellers continue to be seen battling for position around the underside of daily supply coming in at 18207-18117. In the event that the sellers are victorious here, the most we see the DOW dropping to is the daily trendline support extended from the low 17033.
4hr view: (As mentioned in the previous analysis, the DOW has been forming what we believe to be a long-term 4hr bullish pennant pattern – upper trendline extends from the 18279 high, while the lower was drawn from 17556).
Yesterday’s sessions saw the DOW aggressively sell off, slamming itself into 4hr demand at 17898-17949, which, as you can see, held firm allowing longs to just as aggressively push prices back up to the upper limit of the 4hr bullish pennant pattern.
We feel that this index is poised for a breakout; one can almost feel the pressure reaching boiling point! A few candles back, we saw price close above the upper limit of the 4hr pennant and its converging 4hr resistance level seen at 18110. Assuming that the buyers can hold out above this barrier and successfully retest it as support, our team would then begin watching the lower timeframes for buying confirmation, as the runway north would likely be clear all the way up to 4hr supply seen at 18279-18250. The reason we believe prices could move thus far is simply because to the left, we see very little active supply left in this market. Check out the very obvious supply consumption wicks that form our upper limit trendline: 18149/18161/18167.

Current buy/sell orders:
- Buy orders: 18110 region (Predicative stop-loss orders seen at: dependent on where one confirms this level).
- Sell orders: Flat (Predicative stop-loss orders seen at: N/A).
XAU/USD (Gold):
Weekly view: Overall, the weekly trend on Gold is still firmly pointing south in our opinion. Current trading action shows price is now trading relatively deep within weekly supply seen at 1223.1-1202.6. A break above this area could suggest further upside towards the weekly descending trendline extended from the high 1488.0.
Daily view: The rebound seen from the daily demand area at 1178.3-1185.8 on Monday extended higher in yesterday’s session, resulting in price now trading just below the daily swap level 1216.0.
4hr view: After a strong rally north was seen from the 1199.3 area during yesterday’s sessions, price found resistive pressure around the 1214.0 mark. As we can all see, a reaction has already taken place from this level indicating there is selling interest here. This – coupled with the fact that price is trading around resistance on both the weekly and daily timeframes (see above for levels) at the moment, suggests that further selling may take place today.
Taking all of the above into account, our bias for today’s action is firmly short. Our central focus will primarily be around the 1214.0 region. In the event that we find a lower timeframe sell signal informing us that prices will likely continue to decline, we’ll jump in short and look to ride this Gold train down to at least 1207.1, and potentially the 4hr demand area below it at 1199.1-1201.9 given enough time.

Current buy/sell orders:
- Buy orders: Flat (Predicative stop-loss orders seen at: N/A).
- Sell orders: 1214.0 area [Tentative – confirmation required] (Predicative stop-loss orders seen at: dependent on where one confirms this level).
The post Wednesday 29th April: Daily technical outlook and review. appeared first on .
Source:: Wednesday 29th April: Daily technical outlook and review.