
Previous Story
Wednesday 6th May: Volatility may be seen today as Fed Chair Yellen takes center stage
EUR/USD:
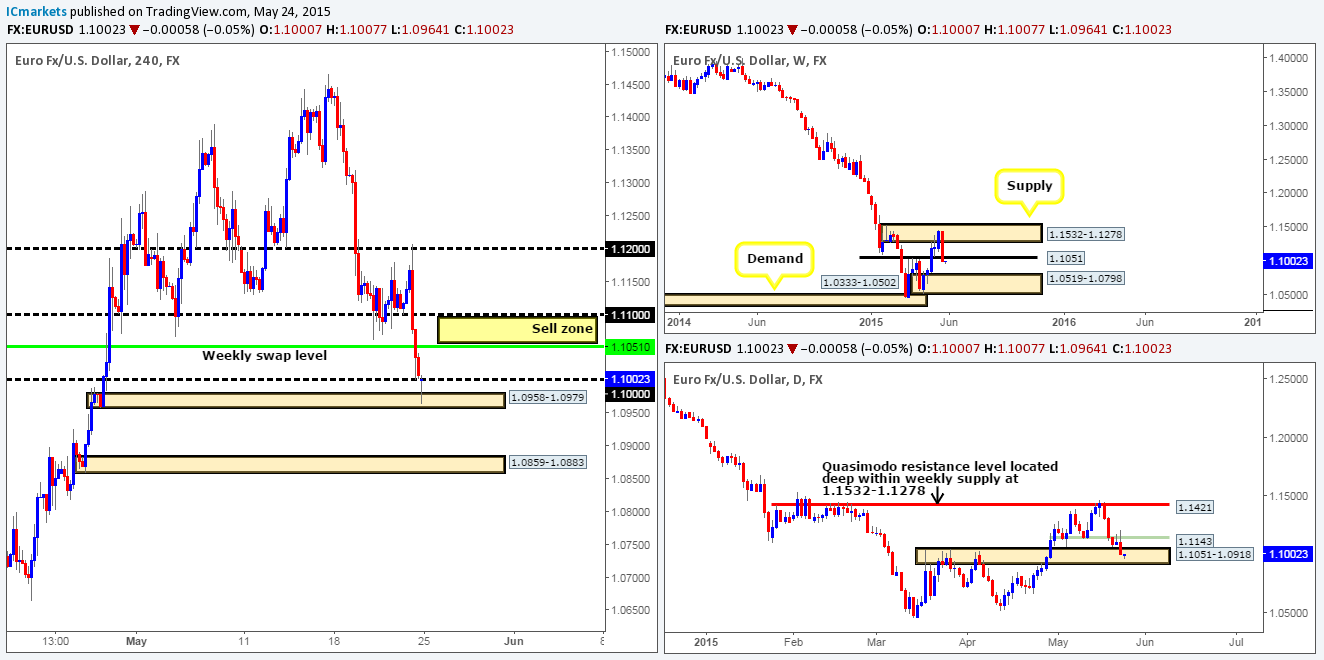
Weekly view: Following last week’s collision with weekly supply at 1.1449-1.1278, price dropped to test the weekly swap level 1.1096 which at this point in time is holding firm. This has been the most bullish we’ve seen the Euro since price began its descent back in May 2014. In spite of this, our long-term bias still remains south and will continue to do so until we see a convincing push above the aforementioned weekly supply area.
Daily view: The most recently closed daily candle tells us that the bulls were the dominant force in the market yesterday. Assuming that the buyers can continue with this tempo, it’s likely that prices could eventually challenge the Harmonic resistance zone (Bat pattern) coming in at 1.1516/1.1376. The reason we feel price could move thus far is simply because most of the sellers that attempted to fade the near-term daily supply area at 1.1244-1.1158 last week have already likely been consumed by the two spikes seen above it.
4hr view: The EUR/USD’s fresh acceleration north recently hit round-number resistance at 1.1200. The rebound from this number looks relatively strong. However, at this point in time, it’s very difficult to see whether this is genuine selling interest or simply longs covering their positions. This is especially difficult considering price is trading from overall higher-timeframe support (see above) at the moment. Because of this, we feel it’s best to sit today’s action out and let price action lead the way.
A close below the mid-level number 1.1150 would likely suggest price is headed back down to retest the round number/weekly swap area at 1.1100/1.1096 (potential intraday shorting opportunity). A close above 1.1200 on the other hand, would be our cue to begin watching for price to retest this number as support. Should this occur, and we see lower timeframe buying strength enter the market, our team would consider entering long and look to take profit around the 4hr swap/round number area at 1.1280/1.1300.
Our current buy/sell orders:
- Buy orders: Flat (Predicative stop-loss orders seen at: N/A).
- Sell orders: Flat (Predicative stop-loss orders seen at: N/A).
GBP/USD:
Weekly view: Last week’s action saw price clash with a weekly supply area coming in at 1.5551-1.5391, consequently forming a beautiful-looking bearish pin-bar candle in the process. Does this mean we should all be looking for shorts this week?
Daily view: Following last week’s strong push below the daily swap area 1.5298-1.5208, yesterday’s daily session saw price retest this area as supply. Provided that the sellers can hold out below this zone, this will likely attract further selling in the market which could see prices dropping down to test the daily swap level seen at 1.4975.
4hr view: The GBP/USD rallied over a 100 pips during yesterday’s sessions. Buying interest came into the market from 1.5100 when Europe opened for business, forcing price to shake hands with 1.5200.
As far as we can see, there are no opportunities to trade at this point in time. However, our team has noted the following:
- A strong close above 1.5200 would likely free the path north for buying up to at least 1.5300. To take advantage of this move, a strong retest needs to be seen with accompanying lower timeframe confirmation. Furthermore, a sustained move above 1.5200 would also likely suggest that the sellers are weak around the aforementioned daily swap area – not a good sign for anyone short this pair!
- If further selling takes place which sees price break below and retest the mid-level number 1.5150, there could potentially be an intraday shorting opportunity down to1.5100 if the lower timeframes confirm selling strength is present.
Our current buy/sell orders:
- Buy orders: Flat (Predicative stop-loss orders seen at: N/A).
- Sell orders: Flat (Predicative stop-loss orders seen at: N/A).
AUD/USD:
Weekly view: At this point in time, price is seen trading between a long-term weekly demand area seen at 0.7449-0.7678, and a weekly swap level coming in at 0.8064.
Daily view: Recent trading action shows price aggressively pushed north from a minor daily swap level seen at 0.7822, consequently closing above a major daily swap level at 0.7875. This move has likely freed the path north for further upside to the weekly swap level region 0.8064.
4hr view: Yesterday’s sessions saw the Aussie pair attack and eventually close above round-number resistance 0.7900. In spite of this, we’re currently seeing weakness in the market around the mid-level number 0.7950. In the event that price continues to sell off from here, it’s likely a retest of the round number 0.7900 will be seen. Buying from here is most certainly a valid trade in our opinion since both the weekly and daily timeframes are showing room for prices to move higher (see above). With that in mind, be prepared for a fake below this round number since the daily swap level sits only 25 pips below it – waiting for lower timeframe confirmation is highly recommended here guys!
In addition to this, one could, if they so wished look to sell from 0.7950 down to 0.7900. Ultimately though, for us to be convinced a move lower is going to take place, we’d need to see a close below the low 0.7931 before thinking of risking capital on this idea.

Our current buy/sell orders:
- Buy orders: 0.7900 [Tentative – confirmation required] (Predicative stop-loss orders seen at: dependent on where one confirms this level).
- Sell orders: 0.7950 mid-level area – a close below 0.7931 would be need to be seen before a sell trade is permitted (Predicative stop-loss orders seen at: dependent on where one confirms this level).
USD/JPY:
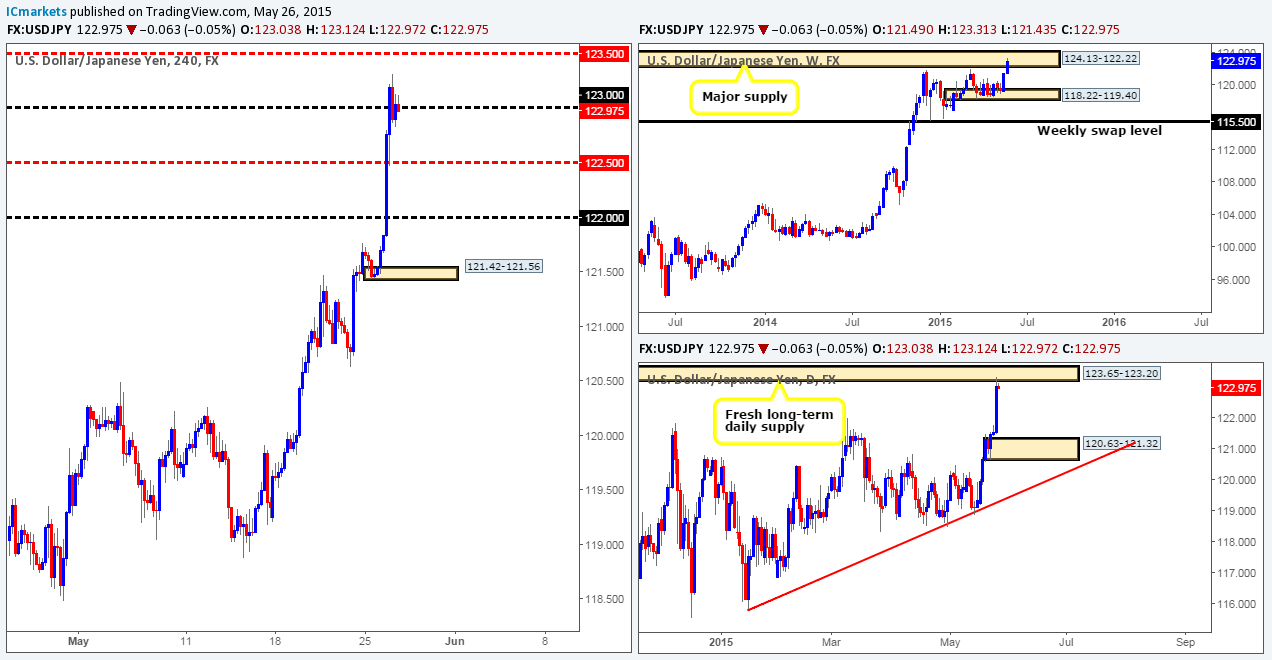
Weekly view: For the past month and a half, the buyers and sellers have been seen battling for position within a weekly demand area coming in at 118.22-119.40. Our long-term bias will remain north on this pair as long as price continues to trade above the weekly swap level seen below this area at 115.50.
Daily view: From this angle, it appears the USD/JPY pair has begun chiseling out a consolidation zone between daily support seen at 118.62 (located deep within the aforementioned weekly demand area), and a daily Quasimodo resistance level coming in at 120.35. Current action shows price has just rebounded from the upper limits of this range, so for anyone considering buying this pair may want to note this down.
4hr view: Following Friday’s close above 120.22, the buyers attempted to rally higher during yesterday’s sessions, but, as you can see only managed to reach the mid-level number 120.50 region before aggressively selling off. The sell off from here took out the round number 120.00 and tested the 4hr demand area seen at 119.60-119.74. From where we’re standing, buying or selling in between these two areas is risky since longs are currently being pulled north from within weekly demand, and shorts are being pulled south from the daily Quasimodo resistance level (see above for levels) – a tug of war!
With all of the above in mind, should we see price close above and retest the 120.00 number today, our team would then begin looking for a confirmed long entry, targeting the 120.30 area to take partial profits – remember, at that point, you’d be trading in line with the weekly scale but going against daily resistance (see above). Conversely, if the sellers close prices below the aforementioned 4hr demand area, there sits potential support at the mid-level number 119.50. Therefore, shorting the break of the 4hr demand area could be a very risky move indeed, waiting for price to close below and retest 119.50 as resistance would be a far more conservative approach and one that we firmly support. Depending on if this happens, keep an eye on the daily timeframe as a close below 119.50 would place you relatively close the ascending daily trendline extended from the low 115.55.
Our current buy/sell orders:
- Buy orders: Flat (Predicative stop-loss orders seen at: N/A).
- Sell orders: Flat (Predicative stop-loss orders seen at: N/A).
USD/CAD:
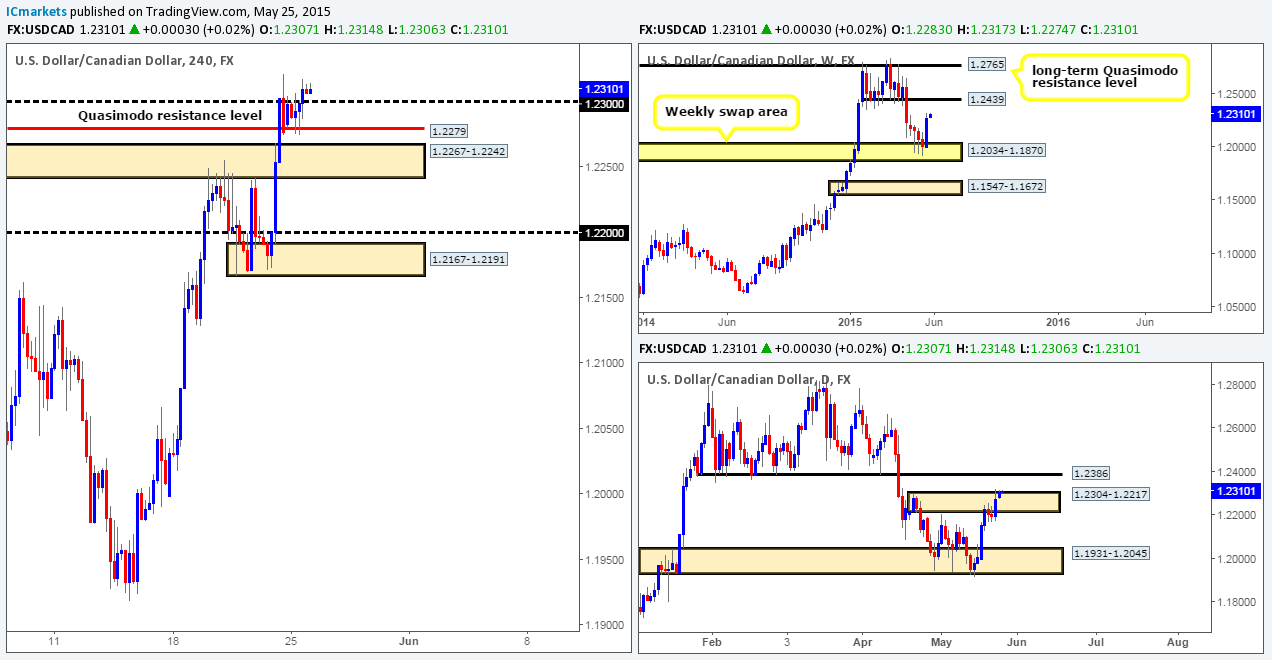
Weekly view: From this angle, we can see price is once again trading below the weekly swap area 1.2265-1.2092. A close below this zone would likely confirm that further downside may ensue towards the weekly swap level 1.1814.
Daily view: The daily timeframe on the other hand, shows that in order for further selling to take place on the weekly timeframe, the daily demand area at 1.1931-1.2045 which converges so beautifully with Harmonic Bat support (completing at 1.1921) will need to be taken out.
4hr view: Buying pressure quickly dried up from 4hr demand at 1.2056-1.2090 yesterday, where at which point the sellers took over and aggressively sold into price. This move took out the round number 1.2100 and tested a small, yet clearly resilient combined 4hr swap/round number area at 1.2014/1.2000, which, as you can see, was clearly an area of interest to active buyers!
We have no interest whatsoever trading at current prices. That being said, if prices close above and retest the 1.2100 round number today, our team would then begin looking for a confirmed long entry, with 1.2150 in mind as a first take-profit target – remember by entering long here, you’re also trading from daily demand at 1.1931-1.2045 and a weekly swap area coming in at 1.2265-1.2092, so all in all a highly confluent trading opportunity. On the flip side, if prices reach 1.2100 today and no close higher is seen, be careful shorting this level. Selling into higher-timeframe opposition is usually not the best way to trade!
Quite frankly, we’d absolutely love for prices to retrace and retest the combined 4hr swap/round number area at 1.2014/1.2000 today. Buying from this area is high-probability in our opinion, but since a test has just recently been seen here, we do not want to take any unnecessary risks as buying strength from this area could be weak now – lower timeframe confirmation will be required before any long positions are initiated.
Our current buy/sell orders:
- Buy orders: 1.2000/1.2014 [Tentative – confirmation required] (Predicative stop-loss orders seen at: dependent on where one confirms this area).
- Sell orders: Flat (Predicative stop-loss orders seen at: N/A).
USD/CHF:
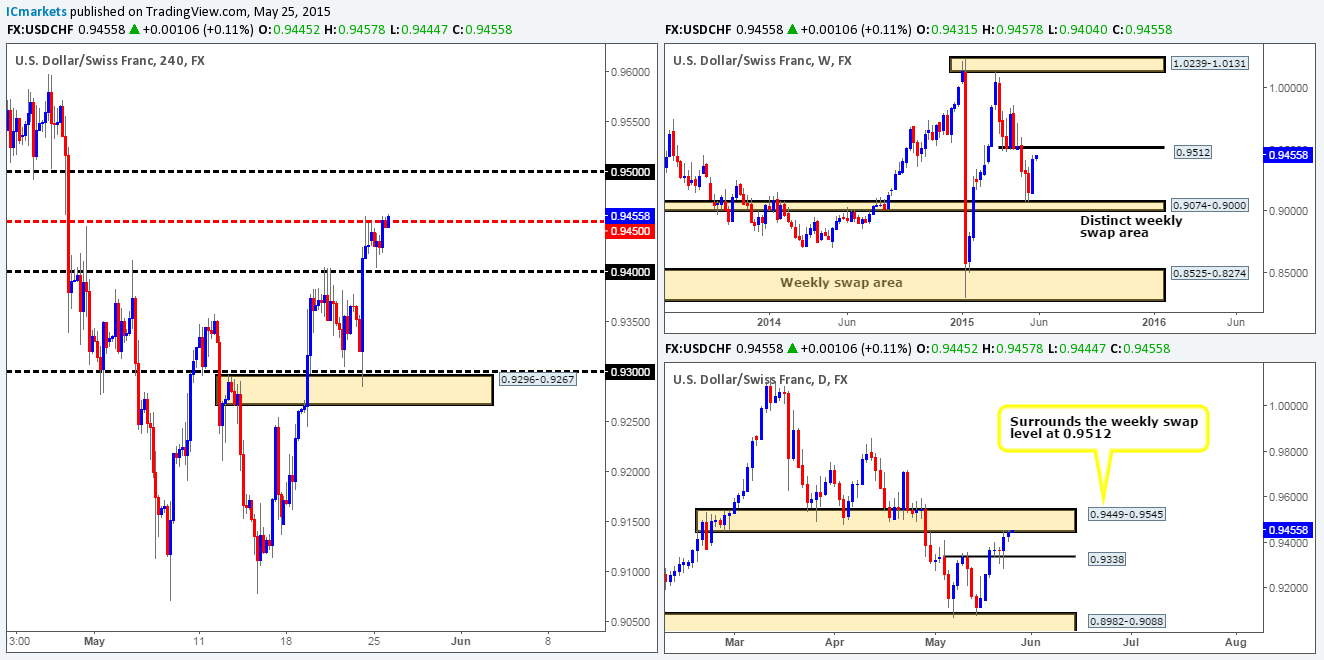
Weekly view: Following the recent break of weekly support at 0.9512, price is now trading relatively deep within a strong-looking weekly demand area coming in at 0.9170-0.9343.
Daily view: The daily timeframe shows that price recently closed below daily demand at 0.9267-0.9334. Traders attempting to fade this area have likely been stopped out, thus the path south could potentially be free for further selling now down to a small daily support area coming in at 0.9155-0.9206 (located within the lower limits of the aforementioned weekly demand area).
4hr view: The 4hr timeframe reveals that price aggressively sold off from 0.9400 yesterday, which, as you can probably see, saw price take out the 0.9300 round number level, thus threatening further downside may be in store.
Given the points made above, today’s spotlight will be firmly focused on the 4hr supply area coming in at 0.9331-0.9295. Should price hit this area of supply today, we’ll be watching to see if the sellers can hold the market below here. If they manage to successfully accomplish this, we’d then look to short (with lower timeframe confirmation) all the way down to the 0.9165 mark. Why that far? Well, take a look below to the left of current price action, can you see the clear demand consumption tails at: 0.9285/0.9267/0.9255/0.9228/0.9194? These tails suggest that demand has already been consumed, thus price could very easily drop down to the next active 4hr support level which is, as far as we can see, the 0.9165 level (positioned deep within the weekly demand area mentioned above at 0.9170-0.9343).
A close above this 4hr supply area on the other hand would likely confirm the following:
- Further buying may be seen up to test the 0.9400 number – potential long opportunity if a confirmed retest of this 4hr supply area is seen.
- The break below daily demand at 0.9267-0.9334 was possibly a fakeout.
- Buying strength may be present within the weekly demand area at 0.9170-0.9343.
Our current buy/sell orders:
- Buy orders: Flat (Predicative stop-loss orders seen at: N/A).
- Sell orders: 0.9331-0.9295 [Tentative – confirmation required] (Predicative stop-loss orders seen at: 0.9335).
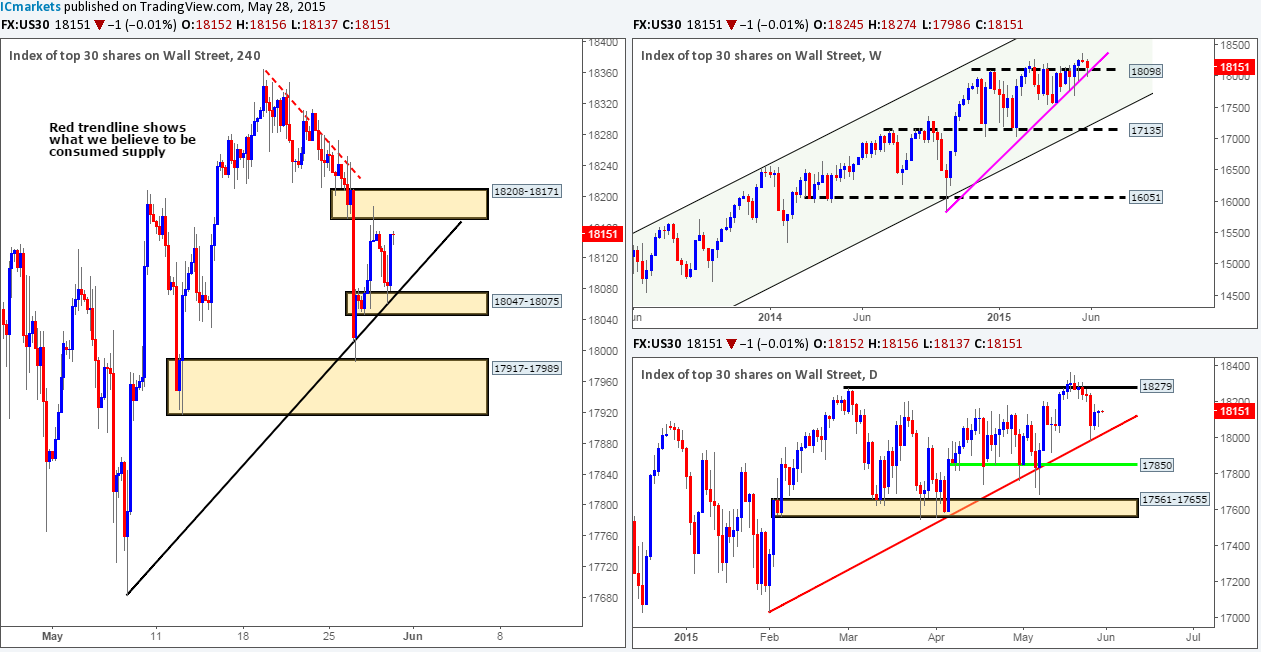
US 30:
Weekly view: Although the overall trend has been strong since early 2009, a temporary ‘ceiling’ to this index has formed around the 18098 region which has remained strong for an impressive four months!
Daily view: From this angle; we can see that prices sold off from the daily supply area 18207-18117 down to the daily trendline level extended from the low 17033. Overall, we’re expecting to see the bulls come back into the market here as a very neat-looking ascending triangle pattern is taking place.
4hr view: (As mentioned in the previous analysis, the DOW has been forming what we believe to be a long-term 4hr bullish pennant formation – upper 4hr trendline extends from the high18279, while the lower 4hr line has been taken from the low 17556).
The DOW, as you can see, rebounded beautifully from the upper limits of the 4hr pennant formation, which converged almost perfectly with 4hr resistance level at 18110. This sell off has once again placed price in ‘no-man’s-land’. With that, we feel there is a good chance that this index still has further to drop. Ideally, what our team would like to see is for price to retest the 4hr ascending trendline extreme, more specifically, the 17817 4hr support level. This would be a high-probability reversal area since it boasts additional support from the daily ascending trendline taken from the low 17033. However, committing to a buy position here by simply placing a pending buy order is a risky trade in our book, we would need to see lower timeframe buying strength before risking any capital on this idea, since fakeouts are common in this vicinity judging by the recent tests of this 4hr support area.
Our current buy/sell orders:
- Buy orders: 17817 [Tentative – confirmation required] (Predicative stop-loss orders seen at: dependent on where one confirms this area).
- Sell orders: Flat (Predicative stop-loss orders seen at: N/A).
XAU/USD (Gold)
Weekly view: From a weekly standpoint, the trend on Gold is still firmly south, and will remain that way in our opinion until price closes above the weekly trendline extended from the high 1488.0. Current price action, however, shows that the weekly candle is now only a stone’s throw away from touching weekly supply at 1223.1-1202.6.
Daily view: The rebound seen on Friday from daily demand at 1159.4-1170.8 (located just within weekly demand at 1130.1-1168.6) continued to extend higher yesterday. In the event that the buyers can continue with this tempo, it’s likely we’re going to see price challenge the newly-formed daily supply area seen at 1215.0-1204.5.
4hr view: For those who read our previous report on Gold, you may recall us mentioning to keep an eye on the 4hr demand area seen at 1180.4-1183.5 for potential buys yesterday. Unfortunately, as you can see, price took off north before reaching our 4hr demand zone and rather annoyingly hit our take-profit level to-the-pip at 1199.1.The rebound seen from 1199.1 sold off only to find supportive pressure come into the market around 1192.7 (Monday’s high now providing support).
Buying from 1192.7 could be a possibility today if the lower timeframes deem it strong enough. Assuming we spot an entry long here, we’ll look to take partial profits at 1199.1 and all being well close our final position around the 4hr supply seen just above it at 1207.3-1203.1 (located just within the aforementioned daily supply area).
Conversely, if price closes below 1192.7 today and retests it as resistance, we’ll then shift our attention to begin looking for shorts (with lower timeframe confirmation), targeting at least the 4hr demand area coming in at 1185.6-1187.4.

Our current buy/sell orders:
- Buy orders: 1192.7 [Tentative – confirmation required] (Predicative stop-loss orders seen at: dependent on where one confirms this level)
- Sell orders: Flat (Predicative stop-loss orders seen at: N/A).
The post Wednesday 6th May: Volatility may be seen today as Fed Chair Yellen takes center stage appeared first on .
Source:: Wednesday 6th May: Volatility may be seen today as Fed Chair Yellen takes center stage


