Previous Story
Weekly review for the GBP / USD pair from March 11 to 16, 2019
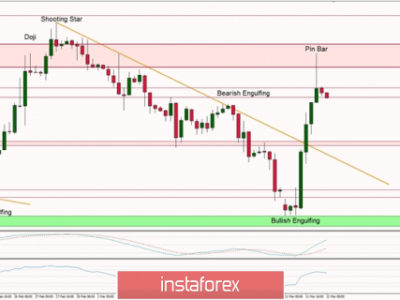
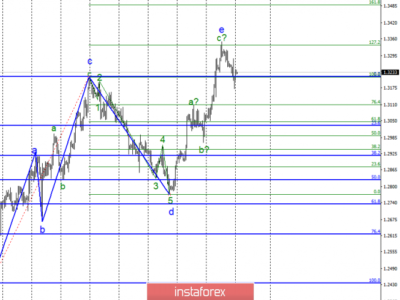
Trend analysis (Fig. 1).
This week, the price will move down with the first target of 1.2894, the support line of the ascending channel (blue bold line).
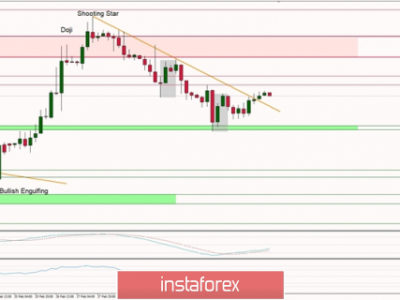
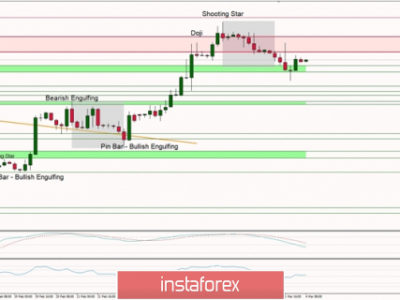
Fig. 2 (weekly schedule).
Comprehensive analysis:
– Indicator analysis – up;
– Fibonacci levels – down;
– Volumes – up;
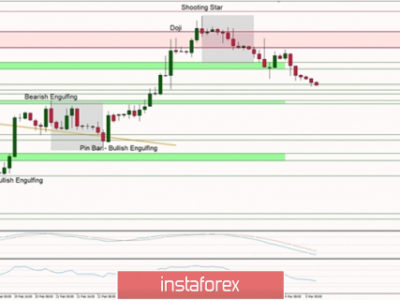
– Candlestick analysis – down;
– Trend analysis – down;
– Bollinger lines – down;
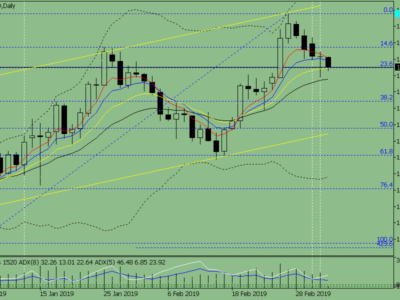
– Monthly schedule – up.
The conclusion on a comprehensive analysis – the downward movement.
The total result of the calculation of the GBP / USD currency pair candle on a weekly schedule: the price of the week is likely to have a downward trend with the presence of the first upper shadow of the weekly black candle (Monday – up) and the second lower shadow (Friday – up).
This week, the price will move down with the first target of 1.2894, the support line of the ascending channel (blue bold line).
The material has been provided by InstaForex Company – www.instaforex.com
Source:: Weekly review for the GBP / USD pair from March 11 to 16, 2019