Previous Story
Weekly USD/JPY analysis
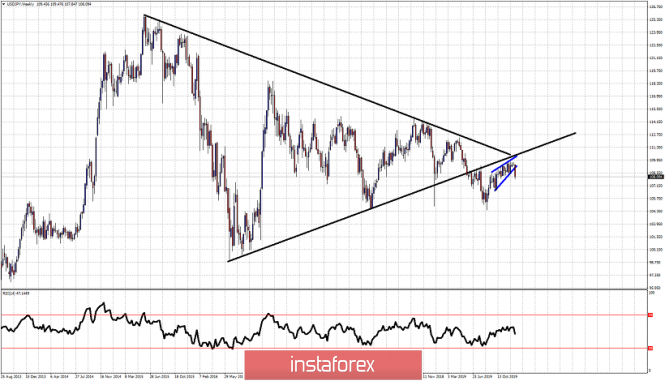
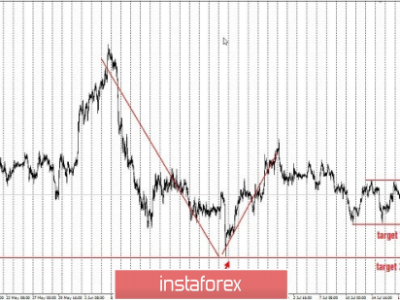
USDJPY has broken down below the upward sloping wedge pattern we have noted in our previous posts. The bearish warning signs we mentioned have been confirmed and price has pulled back from 109.70 to 108.
Black lines – triangle broken
Blue lines -wedge pattern broken
If we zoom out and see where price reversed relative to the bigger picture something worrying for bulls arises. On a weekly basis we see price having broken the long-term triangle pattern. This was a major bearish signal. Price did not break below the 104.80 horizontal support and bounced. Price reached the broken triangle pattern from below but got rejected. Price formed a wedge pattern as we saw in previous posts and has now broken this pattern as well to the downside. This bounce towards the lower triangle boundary and rejection is a bearish sign. This increases the chances of a move back towards 104-105 specially as long as price is below 109.70. Key resistance remains at 109.70. I remain bearish as long as price is below that level.
The material has been provided by InstaForex Company – www.instaforex.com
Source:: Weekly USDJPY analysis