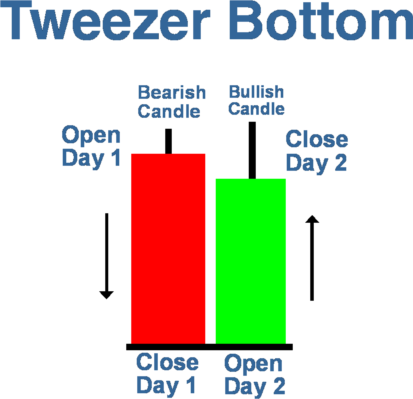
What is a Tweezer Pattern
One of the main ways that forex traders make profits is by predicting and then following trends. This is why traders are always looking for signals that indicate that a trend may be reversing – it allows them to exit positions where they have been following a trend, and to establish new positions to profit from the trend reversal.
One of the most popular indicators for doing this is the double top or double bottom. A double top is when the price rises to a resistance level, falls away, rises again and then falls away again. Similarly, a double bottom is the reverse of this pattern – a fall to support, a brief rise, another fall and then a sustained rise. In both of these cases, the signal is often followed by a sharp trend reversal. This is because it shows that the buyers (in the case of a double top) have run out of momentum, failing to break through resistance more than once – at which point the selling pressure increases.
However, a double top or double bottom is generally a mid-term indicator – it is more useful for swing traders rather than day traders. On the other hand, there is a very similar signal that day traders can use to predict price reversals – this is the tweezer pattern.
A tweezer pattern is formed by two candles, which are either next to each other or separated only by a few candles. Day traders typically look for the formation in five-minute charts to predict short-term price reversals. Here is how to identify a tweezer pattern in an upward trend:
- Look for a candle that sets a new high, potentially indicating hitting a resistance level.
- Then, look for a very short downturn of a few candles.
- After the downturn, look for a new positive candle that hits the same high, confirming the resistance level.
The opposite can be used to identify a tweezer pattern in a downward trend.
Let’s take an example. The EUR/USD rises to 1.3971 in one five-minute candle following a steady rise from 1.3740. At this point, the price declines over three candles to 1.3862. The next candle rises again to exactly 1.3971. At this point, a tweezer has formed. Note that it is important that the second top is exactly the same price as the first top.
In this case, trading the tweezer is relatively straightforward. Place an order 2 pips below the close of the last candle and place a stop 5 pips above it. Then, wait for the price to fall (hopefully) and exit the position at a point that corresponds to a 2 to 1 reward to risk ratio.
 |
 |


