
Previous Story
Daily analysis of GBP/USD for March 23, 2017
Posted On 23 Mar 2017
Comment: 0
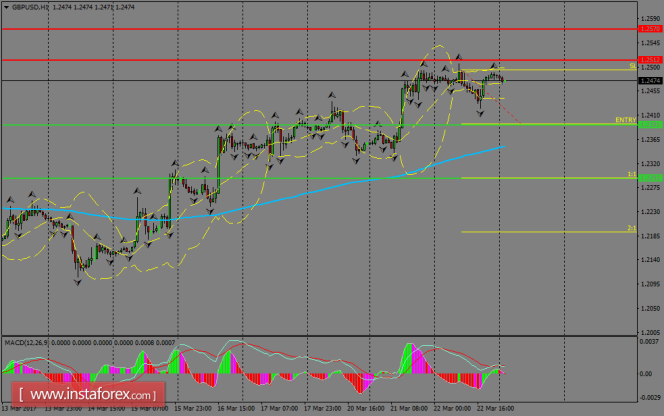
The pair continues to follow the upside bias above the 1.2400 handle across the board, as the resistance zone of 1.2512 still provides a nice barrier to cap further gains. However, if GBP/USD breaks below 1.2391, then it can plunge to test the 1.2292 level, which is below the 200 SMA at H1 chart. MACD indicator is turning flat, favoring for sideways.
H1 chart’s resistance levels: 1.2512 / 1.2570
H1 chart’s support levels: 1.2391 / 1.2292
Trading recommendations for today: Based on the H1 chart, sell (short) orders only if the GBP/USD pair breaks a bearish candlestick; the support level is at 1.2391, take profit is at 1.2292 and stop loss is at 1.2493.
The material has been provided by InstaForex Company – www.instaforex.com


