
Previous Story
Daily analysis of GBP/USD for May 16, 2017
Posted On 16 May 2017
Comment: 0
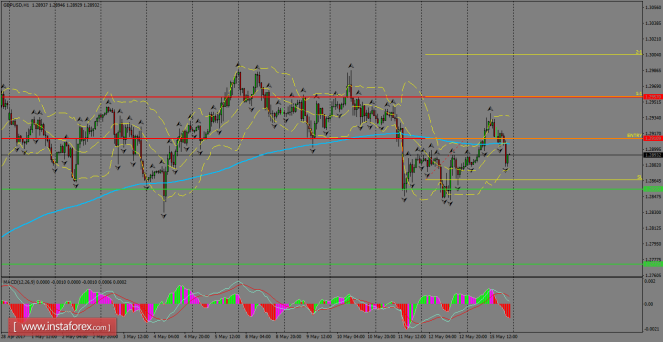
The pair had a quite volatile session on Monday as gains from the early European session were quickly erased in the American session, pushing the Cable to consolidate again below the 1.2900 handle. At present, we’re watching moves below the 200 SMA on H1 chart. The next support is still placed around 1.2855, while to the upside, GBP/USD targets the 1.2957 level.
H1 chart’s resistance levels: 1.2910 / 1.2957
H1 chart’s support levels: 1.2855 / 1.2652
Trading recommendations for today: Based on the H1 chart, buy (long) orders only if the GBP/USD pair breaks a bullish candlestick; the resistance level is at 1.2910, take profit is at 1.2957 and stop loss is at 1.2887.
The material has been provided by InstaForex Company – www.instaforex.com


