
Previous Story
Ichimoku indicator analysis of gold for August 11, 2017
Posted On 11 Aug 2017
Comment: 0
Gold is in a bullish short- and medium-term trend. Gold is breaking above important weekly resistance from its all time highs. We remain long-term bullish Gold.
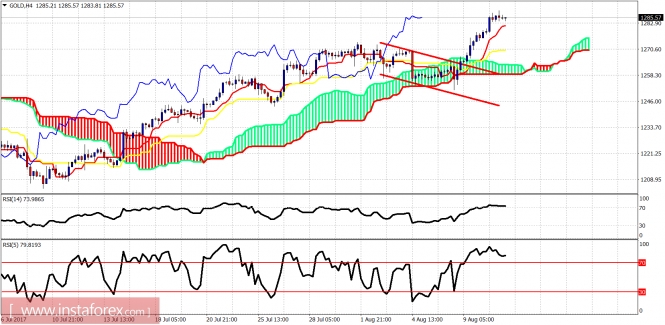
Red lines – bearish channel
Gold price is trading above the 4hour Kumo (cloud) Trend is bullish in the short-term once again after breaking the $1,273 resistance and moving above and out of the bearish channel. We said before that the decline was only a corrective move before the next leg up. So it did happen.
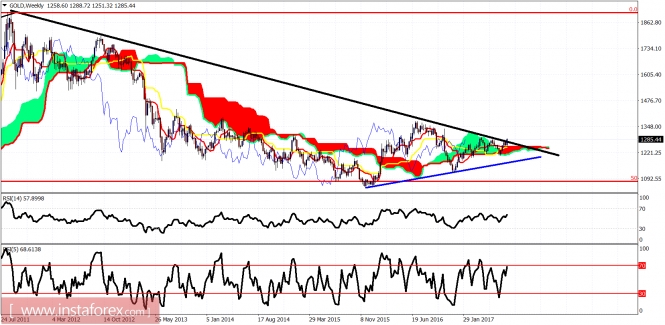
Black line – long-term resistance
Blue line- long-term support
The weekly candle is trying to break above the black long-term trend line resistance from Gold’s all time highs. Weekly trend is bullish as the price is above the Kumo. The back test of the daily Kumo around $1,250 came highly close but support at $1,250 was not broken. The trend is clearly bullish. Looking for a move above $1,310 and then a pull back to back test the long-term trend line.
The material has been provided by InstaForex Company – www.instaforex.com
Source:: Ichimoku indicator analysis of gold for August 11, 2017


