
Previous Story
Technical analysis of GBP/USD for January 15, 2018
Posted On 15 Jan 2018
Comment: 0
Overview:
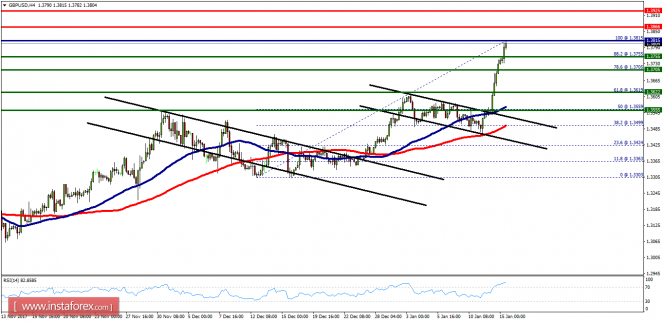
- On the four-hour chart, the GBP/USD pair bullish trend is formed from the support levels of 1.3755 and 1.3705. Currently, the price is in a bullish channel. This is confirmed by the RSI indicator signaling that we are still in a bullish trending market. As the price is still above the moving average (100), immediate support is seen at 1.3755. Consequently, the first support is set at the level of 1.3755. So, the market is likely to show signs of a bullish trend around the spot of 1.3755/1.3770. In other words, buy orders are recommended above the area of 1.3755/1.3770 with the first target at the level of 1.3866. Furthermore, if the trend is able to break through the first resistance level of 1.3866, we should see the pair climbing towards the next target of 1.3925 to test it. It would also be wise to consider where to place a stop loss; this should be set below the second support of 1.3705.
The material has been provided by InstaForex Company – www.instaforex.com


