
Previous Story
Technical analysis of NZD/USD for January 31, 2018
Posted On 31 Jan 2018
Comment: 0
Overview:
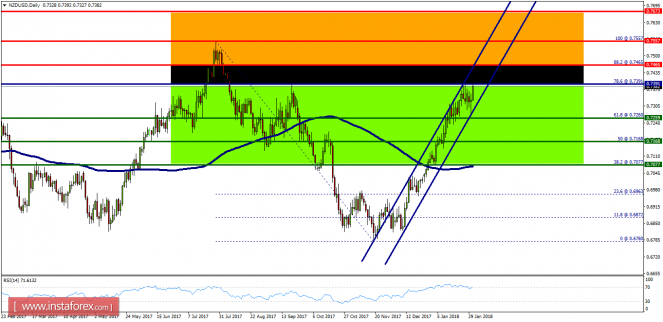
- The NZD/USD pair didn’t make any significant movements yesterday. There are no changes to my technical outlook. The bias remains bullish in nearest term, testing 0.7557 or higher.
The price is set at the pivot point of 0.7391 currently. On the daily chart, the NZD/USD pair continued moving upwards from the level of 0.7260 (golden ratio). The pair rose from the level of 0.7260 (weekly support) to the top around 0.7400. Today, the first support level is seen at 0.7260 followed by 0.7168, while daily resistance is seen at 0.7465. The weekly pivot point lies at the point of 0.7391. According to the previous events, the NZD/USD pair is still moving between the levels of 0.7391 and 0.7465; for that we expect a range of 74 pips in coming hours. This would suggest a bullish market because the RSI indicator is still in a positive area and does not show any trend-reversal signs. Furthermore, if the trend is able to break out through the first resistance level of 0.7465, we should see the pair climbing towards the double top (0.7557) to test it. On the other hand, if a breakout takes place at the support level of 0.7260, then this scenario may become invalidated. Remember to place a stop loss; it should be set below the price of 0.7168.
The material has been provided by InstaForex Company – www.instaforex.com


