
Previous Story
Technical analysis of NZD/USD for August 29, 2017
Posted On 29 Aug 2017
Comment: 0
Overview:
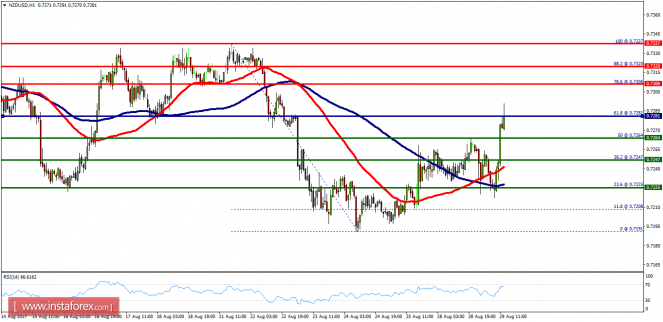
- The NZD/USD pair bullish trend from the support levels of 0.7264 and 0.7281. Currently, the price is in a bullish channel. This is confirmed by the RSI indicator signaling that we are still in a bullish trending market. As the price is still above the moving average (100), immediate support is seen at 0.7264, which coincides with a golden ratio (50% of Fibonacci). Consequently, the first support is set at the level of 0.7264. So, the market is likely to show signs of a bullish trend around the spot of 0.7264/0.7281.
Hence, buy above the levels of 0.7264/0.7281 with the first target at 0.7306 in order to test the daily resistance 1 and further to 0.7320. Also, it might be noted that the level of 0.7337 is a good place to take profit because it will form a double top. On the other hand, in case a reversal takes place and the NZD/USD pair breaks through the support level of 0.6274, a further decline to 0.7225 can occur which would indicate a bearish market.
The material has been provided by InstaForex Company – www.instaforex.com


