
Previous Story
Technical analysis of USD/CAD for August 2, 2017
Posted On 02 Aug 2017
Comment: 0
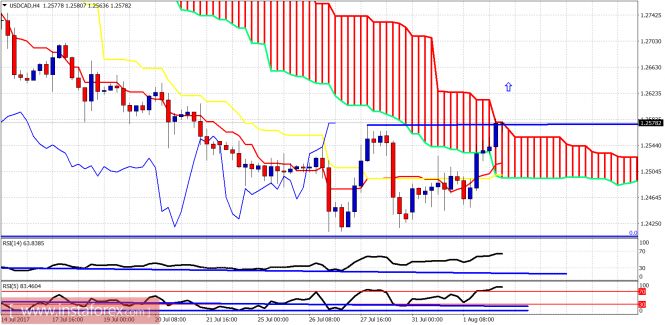
The USD/CAD confirmed the bullish reversal yesterday as price made a higher low and earlier today broke above recent high at 1.2575. The trend is bullish as the price is making higher highs and higher lows.
Blue line – recent high (taken out)
The USD/CAD made a double bottom (higher low slightly) and reversed upwards to break 1.2575. The risk reward around 1.2450 was favoring the bullish scenario as Oil was making new highs while USD/CAD was not making new lows. We previously had noted that the RSI indicators showed reversal signs.
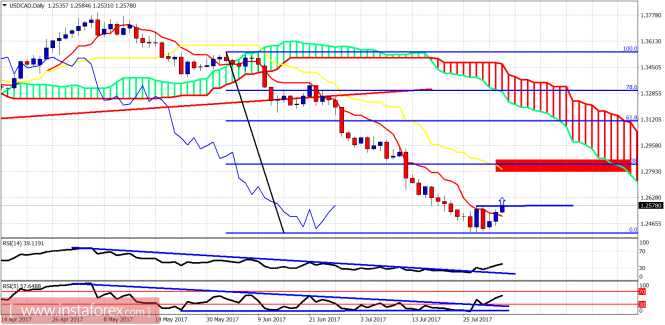
On a daily basis, the RSI has broken out of the wedge pattern and has given a bullish signal. Price is now respecting this signal and is trying to break above 1.26. The 38% Fibonacci retracement is now at 1.28 so this is our target. Support is at 1.2495 so a break below it will not be a good sign for bulls.The material has been provided by InstaForex Company – www.instaforex.com


