
Previous Story
Technical analysis of USD/JPY for September 20, 2017
Posted On 20 Sep 2017
Comment: 0
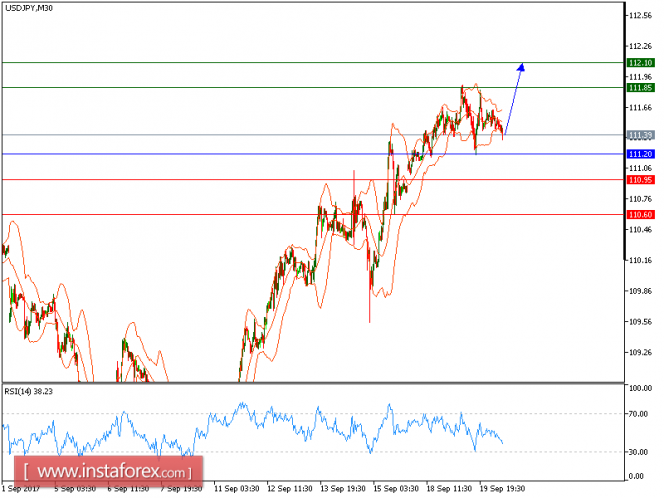
USD/JPY is expected to trade with a bullish bias above 111.20. The pair is consolidating above the key support at 111.20 (the low of September 19), which should limit the downside potential. Even though a continuation of the consolidation cannot be ruled out, its extent should be limited.
Hence, above 111.20, expect a rebound to 111.85. A break above this level would trigger a new rise to 112.10.
Alternatively, if the price moves in the opposite direction, a short position is recommended below 111.20 with a target at 110.95.
Chart Explanation: The black line shows the pivot point. The current price above the pivot point indicates a bullish position, while the price below the pivot point is a signal for a short position. The red lines show the support levels and the green line indicates the resistance level. These levels can be used to enter and exit trades.
Strategy: BUY, Stop Loss: 111.20, Take Profit: 111.85
Resistance levels: 111.85, 112.10 and 112.40 Support Levels: 110.95, 110.60, 110.20
The material has been provided by InstaForex Company – www.instaforex.com
Source:: Technical analysis of USD/JPY for September 20, 2017


