
Previous Story
Daily analysis of GBP/USD for April 05, 2017
Posted On 05 Apr 2017
Comment: 0
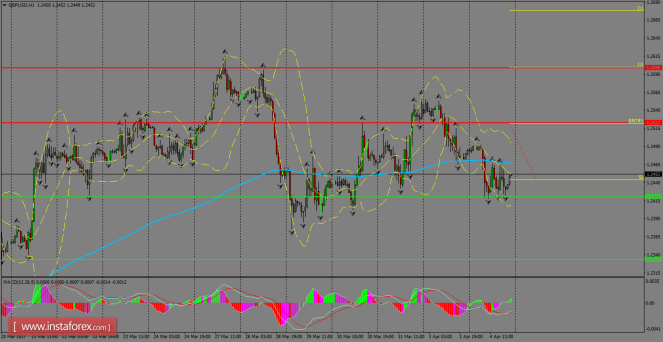
GBP/USD is an area where a strong demand zone is placed and trying to support the price action for the short-term, despite it’s located below the 200 SMA. However, because of that dynamic bottom, the Cable may start to rebound in order to reach the resistance zone of 1.2522. If the pair manages to break above that level, then it can reach as long as 1.2598.
H1 chart’s resistance levels: 1.2522 / 1.2598
H1 chart’s support levels: 1.2420 / 1.2333
Trading recommendations for today: Based on the H1 chart, buy (long) orders only if the GBP/USD pair breaks a bullish candlestick; the resistance level is at 1.2522, take profit is at 1.2598 and stop loss is at 1.2447.
The material has been provided by InstaForex Company – www.instaforex.com


