
Previous Story
Daily analysis of GBP/USD for April 06, 2017
Posted On 06 Apr 2017
Comment: 0
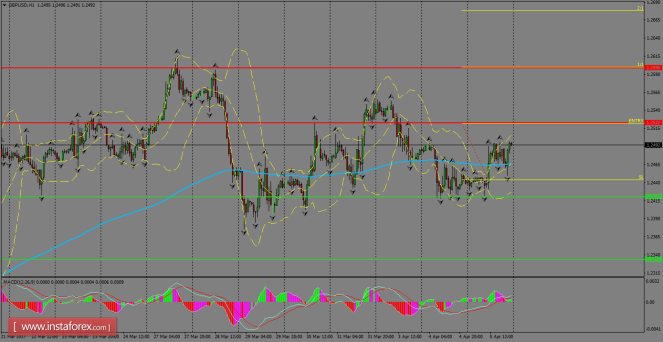
The pair continues to find support above the 1.2420 after FOMC
minutes were released during Wednesday’s session. As for now,
GBP/USD is heading toward the next resistance around 1.2522, where a
breakout should deliver more bullish bias toward 1.2600 in the
short-term. The risk remains to the upside, as long as the Cable
manages to stay above March 24th lows.
H1 chart’s resistance
levels: 1.2522 / 1.2598
H1 chart’s support levels:
1.2420 / 1.2333
Trading recommendations for today: Based on the H1 chart,
buy (long) orders only if the GBP/USD pair breaks a bullish
candlestick; the resistance level is at 1.2522, take profit is at
1.2598 and stop loss is at 1.2447.
The material has been provided by InstaForex Company – www.instaforex.com


