
Previous Story
Daily analysis of GBP/USD for April 10, 2017
Posted On 10 Apr 2017
Comment: 0
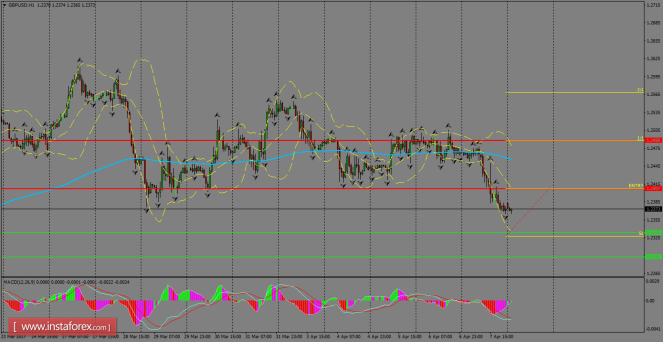
The pair plummeted during Friday and now it’s heading towards
1.2333, as the Cable is trying to break the range where the price
action has been moving on. If GBP/USD manages to break the next
target at the 1.2333 level, then it can test the 1.2292 zone. MACD
indicator is turning flat, calling for more sideways in coming days.
H1 chart’s resistance
levels: 1.2407 / 1.2488
H1 chart’s support levels:
1.2333 / 1.2292
Trading recommendations for today: Based on the H1 chart,
buy (long) orders only if the GBP/USD pair breaks a bullish
candlestick; the resistance level is at 1.2407, take profit is at
1.2488 and stop loss is at 1.2327.
The material has been provided by InstaForex Company – www.instaforex.com


