
Previous Story
Daily analysis of GBP/USD for August 30, 2017
Posted On 30 Aug 2017
Comment: 0
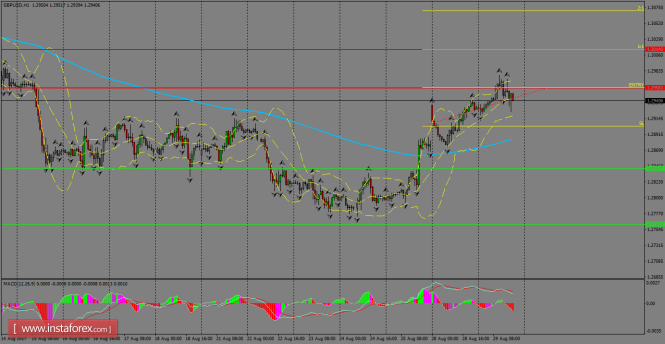
The pair remains favored by the weakness in the US Dollar and now it’s testing the resistance level of 1.2958. With a breakout above that zone, we can expect further strength towards 1.3013 and it’s something that indicators are favoring. However, corrective moves should take place towards the 200 SMA at H1 chart.
H1 chart’s resistance levels: 1.2958 / 1.3013
H1 chart’s support levels: 1.2842 / 1.2761
Trading recommendations for today: Based on the H1 chart, buy (long) orders only if the GBP/USD pair breaks a bullish candlestick; the resistance level is at 1.2958, take profit is at 1.3013 and stop loss is at 1.2903.
The material has been provided by InstaForex Company – www.instaforex.com


