
Previous Story
Daily analysis of GBP/USD for December 04, 2017
Posted On 03 Dec 2017
Comment: 0
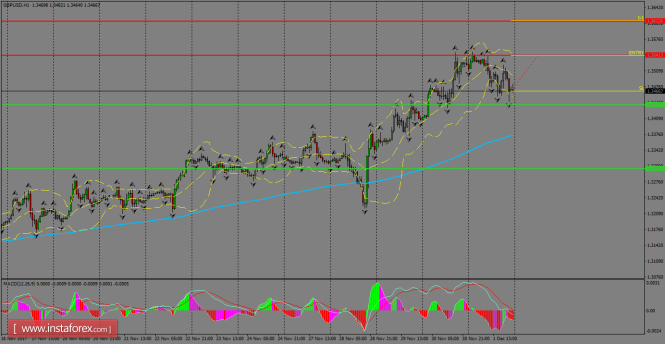
GBP/USD has reached a key resistance zone at 1.3541, where we could expect some pullbacks in order to correct the overall bullish bias in the short-term. If the pair manages to break above 1.3541, then we might expect a continuation to test fresh highs, with the nearest target lying at 1.3612. MACD indicator still supports the idea of another leg lower.
H1 chart’s resistance levels: 1.3541 / 1.3612
H1 chart’s support levels: 1.3437 / 1.3303
Trading recommendations for today: Based on the H1 chart, buy (long) orders only if the GBP/USD pair breaks a bullish candlestick; the resistance level is at 1.3541, take profit is at 1.3612 and stop loss is at 1.3466.
The material has been provided by InstaForex Company – www.instaforex.com


