
Previous Story
Daily analysis of GBP/USD for May 05, 2017
Posted On 05 May 2017
Comment: 0
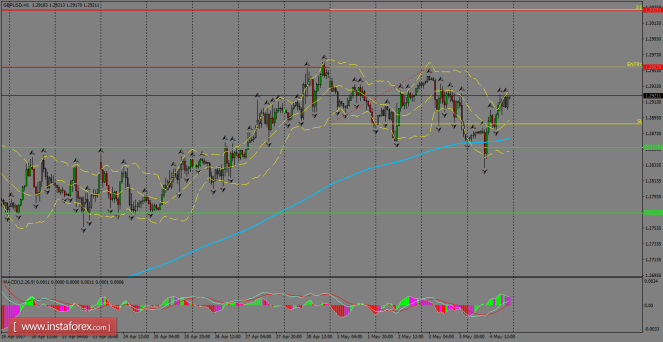
GBP/USD managed to rebound above the 200 SMA on H1 chart amid a broad-based weakness in the US Dollar. The pair is still trapped in a range established since April 28th. Now the pair aims to test the resistance zone of 1.2957 once again. If it
manages to break above that area, we can expect further advances
toward the 1.3029 level.
H1 chart’s resistance
levels: 1.2957 / 1.3029
H1 chart’s support levels:
1.2855 / 1.2652
Trading recommendations for today: Based on the H1 chart,
buy (long) orders only if the GBP/USD pair breaks a bullish
candlestick; the resistance level is at 1.2957, take profit is at
1.3029 and stop loss is at 1.2887.
The material has been provided by InstaForex Company – www.instaforex.com


