
Previous Story
Daily analysis of GBP/USD for November 29, 2017
Posted On 29 Nov 2017
Comment: 0
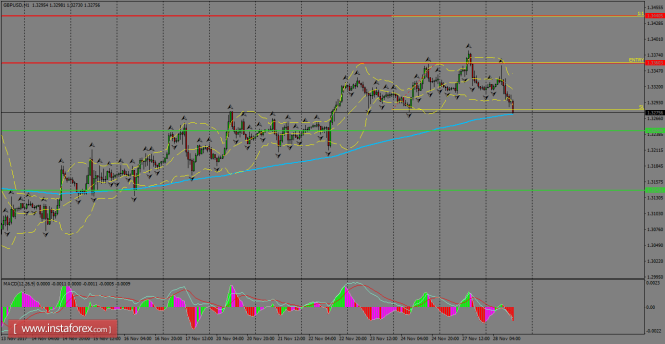
The pair is plummeting below the 1.3300 handle and it’s testing the 200 SMA at the H1 chart, where bulls could appear once again in order to resume the mentioned path. To the downside, the support level of 1.3244 could be a solid hurdle to break before to reach the next level at 1.3143. MACD indicator remains in the negative territory, favoring to the bears.
H1 chart’s resistance levels: 1.3360 / 1.3440
H1 chart’s support levels: 1.3244 / 1.3143
Trading recommendations for today: Based on the H1 chart, buy (long) orders only if the GBP/USD pair breaks a bullish candlestick; the resistance level is at 1.3360, take profit is at 1.3440 and stop loss is at 1.3280.
The material has been provided by InstaForex Company – www.instaforex.com


