
Previous Story
Daily analysis of USDX for August 11, 2017
Posted On 11 Aug 2017
Comment: 0
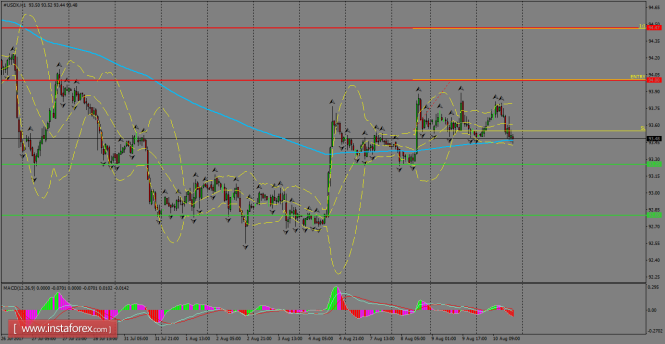
The index has been hovering around the 200 SMA zone at H1 chart and waits for a catalyst that helps to find a clear direction for the short-term. That moving average is expected to provide dynamic support across the board and next target should be the resistance and psychological level of 94.00 to the upside. MACD indicator remains in the negative territory, favoring to the bears.
H1 chart’s resistance levels: 94.00 / 94.47
H1 chart’s support levels: 93.25 / 92.80
Trading recommendations for today: Based on the H1 chart, place buy (long) orders only if the USD Index breaks with a bullish candlestick; the resistance level is at 94.00, take profit is at 94.47 and stop loss is at 93.55.
The material has been provided by InstaForex Company – www.instaforex.com


