
Previous Story
Daily analysis of USDX for July 10, 2017
Posted On 10 Jul 2017
Comment: 0
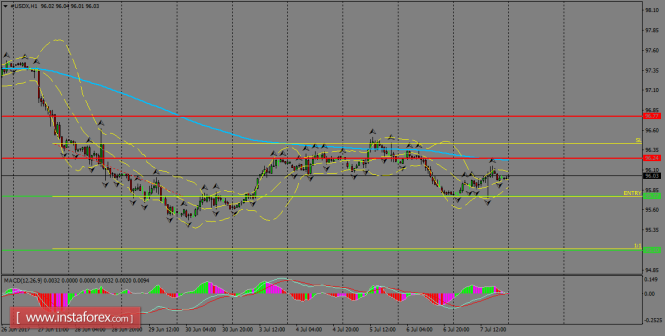
The greenback continues to find a bottom around 95.77 and it will try to test the 200 SMA at H1 chart in order to break higher. However, as long as it stays below that moving average, USDX will try to look for the 95.10 level in the short-term and it would happen after a breakout below 95.77. MACD indicator is turning flat, calling for sideways.
H1 chart’s resistance levels: 96.77 / 97.20
H1 chart’s support levels: 96.38 / 95.77
Trading recommendations for today: Based on the H1 chart, place sell (short) orders only if the USD Index breaks with a bearish candlestick; the support level is at 95.77, take profit is at 95.10 and stop loss is at 96.42.
The material has been provided by InstaForex Company – www.instaforex.com


