Previous Story
EURUSD Long Term Analysis with Renko Charts
The EURUSD is a tricky currency pair to trade. Being one of the most liquid of instruments in the currency markets, the EURUSD is often prone to short term noise in the markets that can throw traders off guard. While randomly watching some Renko charts, I came across the 100 Pip EURUSD fixed box Renko and certain things caught my attention. In this article, I aim to present these findings. Bear in mind that because of the rather large box size (or Pip size) we are in fact looking at the longer term charts (akin to weekly or monthly time frames from the regular charts).
EURUSD – Renko Chart Analysis
The chart below might look a bit cluttered at the first glance; however focus your attention to the following elements, in order of importance.
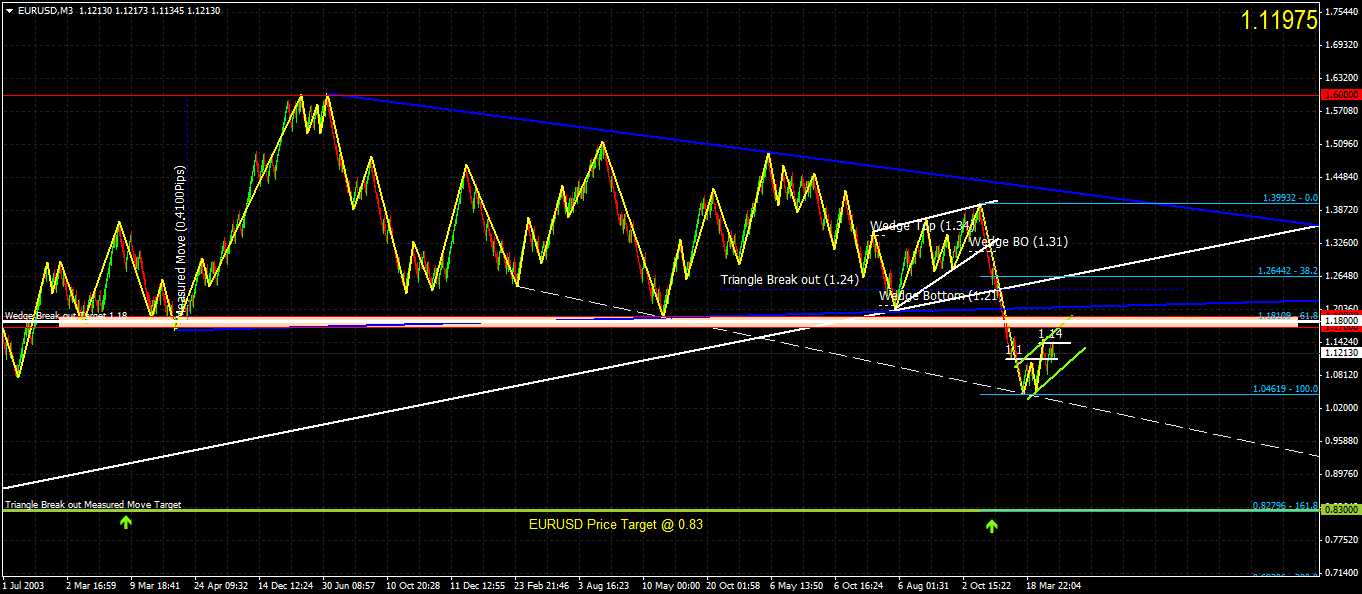
- Symmetrical Triangle (denoted in Blue)
- Rising Wedge (denoted in White)
- Bear Flag (denoted in Green)
Symmetrical Triangle
The large symmetrical triangle is obviously the first point to start our analysis. After alternating peaks and troughs, EURUSD broke out from this large consolidation phase rather rapidly.
Using the Symmetrical Triangles measured move approach; the minimum price objective was achieved at 1.18 (shown in white).
Measuring the distance between A – B which was 4100 pips, the break out from 1.24 points to an eventual objective to 0.83.
Rising Wedge
Within the larger triangle, there was a rising wedge pattern that initially signaled a potential break down of prices. In this secondary chart pattern, using the same measured move approach, we get about 1300pips as the measured distance. When applied to the wedge’s break out level at 1.31, the rising wedge pointed to a minimum target level of 1.18.
Bear Flag
After price declined further below 1.18, we are currently in a consolidation phase with a potential bear flag taking shape. Of course, readers should note that the flag pattern isn’t complete yet and we need to see a break down from the flag to ascertain this view.
At the moment, a double top has formed near 1.14, while support is at 1.1. A break below 1.1 and preferably a pullback could be the key to signaling further decline in EURUSD.
Applying the measured move approach to this bear flag, we understand that the minimum objective comes down to 0.82796 (or round it off to 0.83). The bear flag’s target sits right on the same area as the larger triangle’s measured move objective.
Determining Ideal Entry Levels in the EURUSD
Now that we have a clear picture of what’s going on, the obvious question is what price level to take a short position.

On the chart, it is not hard to miss the support at 1.19 – 1.17. While this might seem a rather large price range, it is well acceptable considering that we are looking at a 100 pip box size. To determine the ideal position to enter on the short side of EURUSD, we could make use of the Elliott Wave principle. The waves are labeled in Pink, which shows the third wave currently being concluded. We ‘assume’ that wave three has concluded, as the entire wave declined to 1.618% of wave 1.
This means that we could possibly anticipate the 4th wave to conclude anytime soon and wait for the 5th wave to start.
The 4th wave usually concludes near 38.2% of wave 3, and when applying this to the wave 3, we get 1.18109 as the potential area for the 4th wave to conclude.
1.18 also was our previously marked region of support that was broken by wave 3. Therefore, it is not surprising to note that we could see a rally back to 1.18 to test this broken support for resistance.
If our above assumptions are correct, this would mean that the bear flag will have to be readjusted to see how the analysis fits in.
For the moment, 1.18 – 1.19 is an ideal price level to watch for potential short entry in the longer term. For the short term, the current double tip at 1.14 could see a decline to 1.04 on break of 1.09. A close above 1.14 could set the stage for a test to 1.18 – 1.19.