
Previous Story
Friday 12th December: Daily technical outlook and review.
Posted On 11 Dec 2014
Comment: 0
EUR/USD:
Weekly Timeframe: The Euro did indeed continue to rally from a weekly Quasimodo support area coming in at 1.22403-1.22942 up to a minor weekly swap level seen at 1.24996. This move consequently allowed sellers to come back into the market.
Daily Timeframe: The daily timeframe shows that sellers entered the market yesterday from within a daily supply area seen at 1.25056-1.24180, which incidentally is seen just below the aforementioned weekly swap level. Assuming that the sellers do not lose their enthusiasm here, a test of a long-term daily demand area seen at 1.21326-1.22234 could be seen (located just below the aforementioned weekly Quasimodo support area). It will be interesting to see what the 4hr timeframe chart shows.
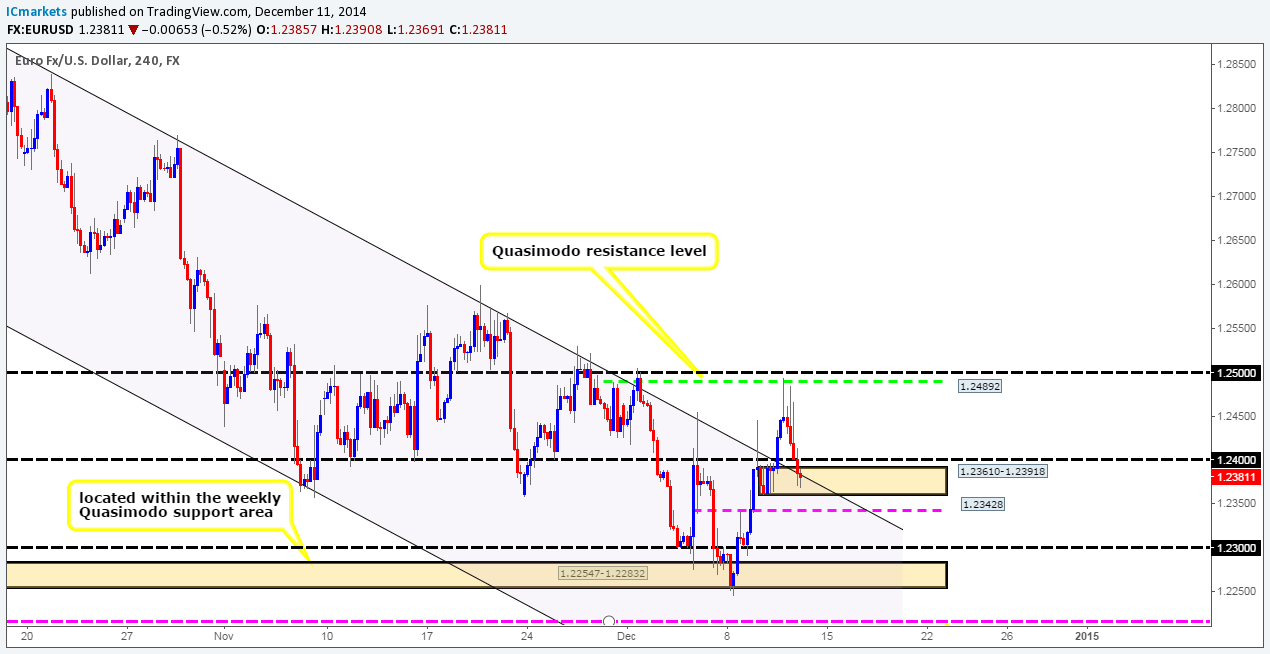
4hr Timeframe: For anyone who read our previous report on this pair, you may recall us mentioning that we were looking for confirmed longs from around 1.24 targeting the 4hr Quasimodo resistance level at 1.24892. As we can all see price did indeed reach the target, but failed to give us our entry.
The selling momentum seen from 1.24892 has forced the market down to a nice-looking 4hr demand area seen at 1.23610-1.23918. Buying from here is indeed tempting, since it lines up beautifully with the downtrend channel support (prior resistance). However, we are going to hold fire here as we do not want to be buying from higher-timeframe sellers (Weekly swap level: 1.24996 – Daily supply: 1.25056-1.24180).
That being said though, if the 1.24 level is taken out, and retested as support, we would consider buying a short-term position with the take-profit target set around the aforementioned 4hr Quasimodo resistance level. Other than this though, we do not see any other safe entries on this pair for the time being.
Current buy/sell levels:
- Buy orders: Flat (Predicative stop-loss orders seen at: N/A).
- Sell orders: Flat (Predicative stop-loss orders seen at: N/A).
GBP/USD:
Weekly Timeframe: At this point in time, the buyers and sellers are seen battling around a weekly swap level at 1.57166. A weekly close above here would likely entice further buying, and could potentially see the market trade up to 1.58934, another weekly swap level.
Daily Timeframe: The daily timeframe is currently showing indecision around the aforementioned weekly swap level. In the event that the buyers outweigh any selling opposition here, price will very likely test a daily supply area seen just above at 1.59438-1.58338. Let’s see what we can find on the 4hr timeframe.
4hr Timeframe: The 4hr timeframe shows that our pending sell order was indeed filled (1.57282) sometime yesterday. We have closed most of our position already around 1.56581. We intend to let the remainder of the position run with our stop set firmly at breakeven.
At this point in time, we do not see any safe entries on this pair. Buying here would likely not be the best path to take for obvious reasons (higher-timeframe resistance – see above), and selling here (effectively adding to our current position) would not offer good enough risk/reward. Therefore, we are going to patiently watch the remainder of our sell position, and see how price behaves in the later sessions.
Current buy/sell levels:
- Buy orders: Flat (Predicative stop-loss orders seen at: N/A).
- Sell orders: 1.57282 [Still live with a small position left running] (Predicative stop-loss orders seen at: 1.57712).
AUD/USD:
Weekly Timeframe: The weekly timeframe shows that price is currently trading around a long-term downtrend channel support (0.97569/0.88468), seen deep within a major weekly demand area coming in at 0.80646-0.84601.
Daily Timeframe: Since the market opened on Monday, indecision is clearly evident around a daily swap level seen at 0.82625. Price has faked lower into a daily demand area at 0.80809-0.82270 already twice this week, once on Tuesday, and once yesterday. We have to be honest here, we are not holding out much hope of higher prices being seen from here. Let’s see what the 4hr timeframe has to say about this.
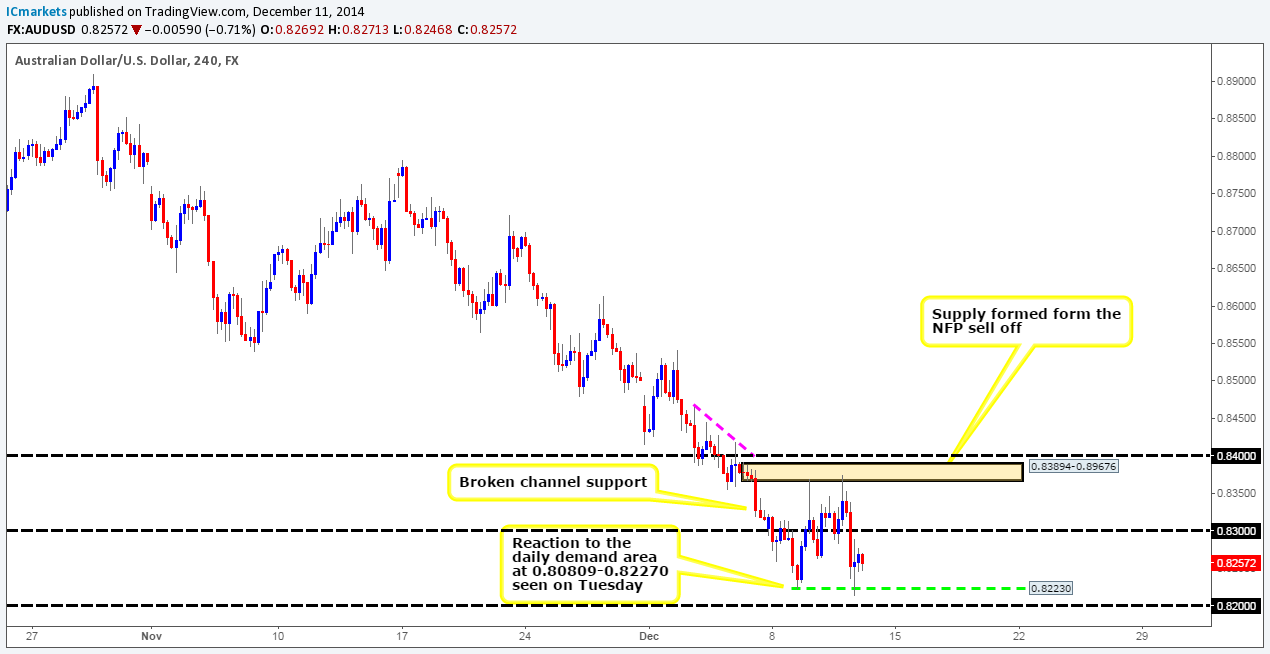
4hr Timeframe: Yesterday saw price rally from 0.83 up to a 4hr supply area seen at 0.83894-0.89676, where a beautiful reaction was seen. Active sellers were clearly waiting as the market sold off around 160 pips in total.
The recent selling momentum saw the market fake below the low 0.82230. This move possibly stopped out traders trying to fade this level, and also trapped any eager breakout sellers. Pro money very likely took advantage of this liquidity offering (sells for their buys) as we can see price did indeed see a reaction north.
Even with Aussie currently trading in clear higher-timeframe demand (see above) at the moment, risk/reward considerations argue against entering long with prices so close to 0.83. In the event that a rally is seen from here, and some of the sellers are taken out around this level, we would then consider buying with lower timeframe confirmation. Unfortunately though, until that happens, we are going to have to sit on our hands and be patient.
Current buy/sell levels:
- Buy orders: Flat (Predicative stop-loss orders seen at: N/A).
- Sell orders: Flat (Predicative stop-loss orders seen at: N/A).
USD/JPY:
Weekly Timeframe: Aggressive selling has been seen on the USD/JPY pair from just below a weekly Quasimodo resistance level at 122.180. This has consequently forced prices down to a weekly swap area coming in at 117.931-116.799, where at the time of writing, buying interest appears to be coming into the market.
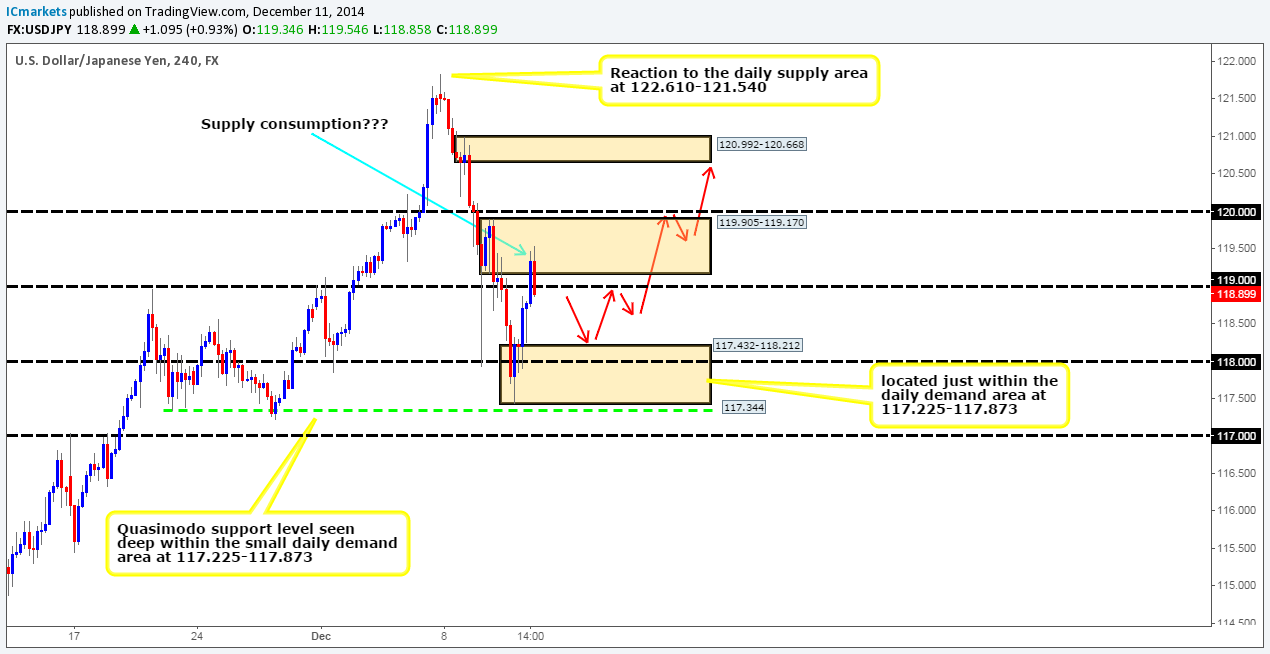
Daily Timeframe: The reason for the buying interest likely stems from a small daily demand area coming in at 117.225-117.873. If further buying is seen, there is very little in our opinion stopping prices from rallying back up towards the daily supply area seen at 122.610-121.540 (encapsulates the aforementioned weekly Quasimodo resistance level).
4hr Timeframe: As we can all see, price did indeed react bullishly around the 4hr Quasimodo support level at 117.344. We do hope some of our readers caught part of this move; unfortunately, we could not find any corresponding lower-timeframe confirmation to allow us to ride this wave.
The recent rally north saw price close above 119 into a 4hr supply area coming in at 119.905-119.170, where we believe most of the supply has been consumed. Considering where we are located in the bigger picture (see above), our bias for the time being is long. And as such, we’ll be watching a combined 4hr demand/round number area at 117.432-118.212/118 for lower-timeframe confirmed entries north with an overall take-profit target set at 120.591, just below a 4hr supply area seen at 120.992-120.668. However, in the event we do find an entry long here, we’re not expecting price to shoot straight to the target, road bumps will no doubt cause retracements, as per the red arrows on the chart.
Current buy/sell levels:
- Buy orders: Will be watching for lower-timeframe confirmation between 117.432/118.212 (Predicative stop-loss orders seen at: dependent on where one sees confirmation).
- Sell orders: Flat (Predicative stop-loss orders seen at: N/A).
USD/CAD:
Weekly Timeframe: The weekly timeframe shows that the USD/CAD pair has increased in value. As a consequence, price is now trading just below a weekly supply area at 1.17225-1.15417 (located within a larger weekly supply area seen at 1.18061-1.14739). Let’s see what the lower timeframes have to say about this.
Daily Timeframe: The daily timeframe indicates that before any selling is seen from the weekly supply area mentioned above (1.17225-1.15417), further buying may take place. The reason we believe this to be true is simply because price has recently closed above a major daily swap level coming in at 1.14861. In addition to this, the path north above this level is clear of resistance (in our opinion) up to a daily supply area coming in at 1.17225-1.16182 (located deep within the weekly supply area just mentioned).
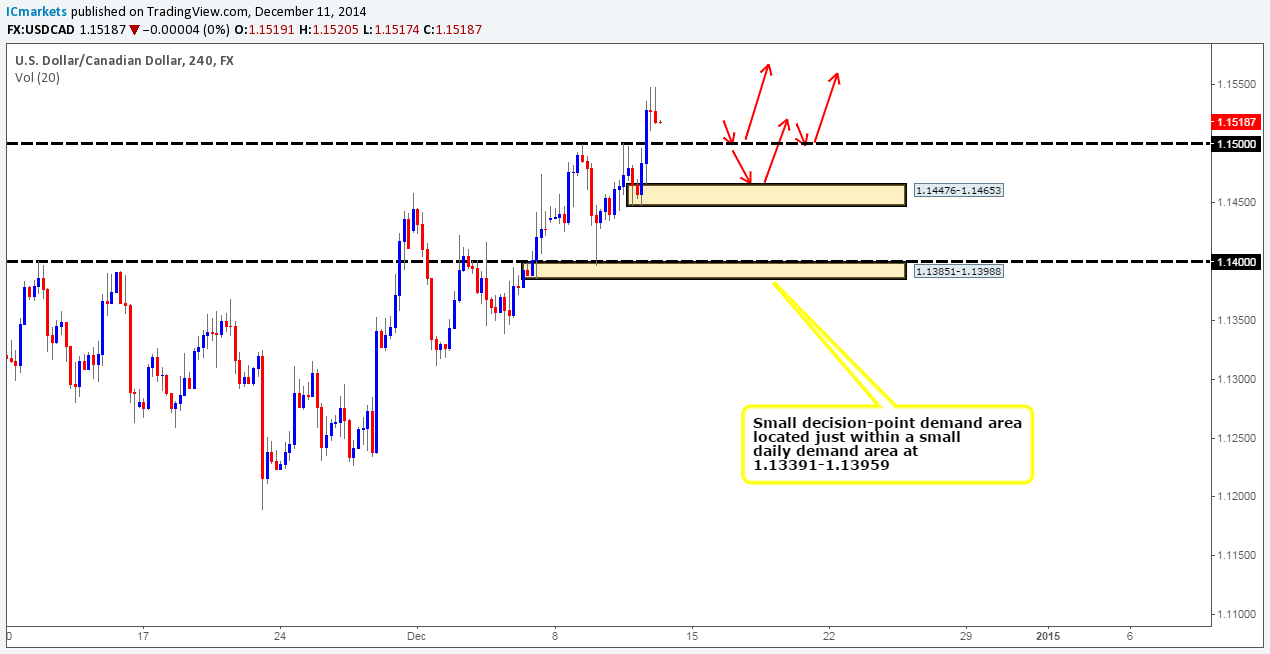
4hr Timeframe: The USD/CAD pair did indeed see further selling from 1.15; nonetheless, it was short lived. Buyers aggressively came into the market around 1.14451 and broke above 1.15, which as of yet has not seen a retest.
Considering the price structure on the higher timeframes at the moment (see above), we are relatively confident a rally higher will ensue. The most likely scenario we see playing out is as follows: Price will decline in value down towards 1.15, and test this level for buying strength, if there are not enough buyers here, price will slide down towards a 4hr decision-point demand area at 1.14476-1.14653. This area is important to us since it was likely here where pro money made the ‘decision’ to trade above the aforementioned daily swap level. That being the case, we are going to be watching for lower-timeframe buying confirmation around the 1.15036 (just above the round number 1.15), and we’ll place a pending buy order at 1.14688, as it is very likely there are unfilled buy orders still lurking here – hence a reaction is possible.
For anyone considering trading these levels, please remain aware that we are effectively buying into higher-timeframe supply here, and as such, all long trades should be carefully monitored.
Current buy/sell levels:
- Buy orders: 1.15036 [Tentative] (Predicative stop-loss orders seen at: Dependent on where this level is confirmed) 1.14688 (Predicative stop-loss orders seen at: 1.14407).
- Sell orders: Flat (Predicative stop-loss orders seen at: N/A).
DAX 30:
Weekly Timeframe: The weekly timeframe shows that the German index has seen relatively aggressive selling from 10090 down towards 9790, a weekly swap level. It will be interesting to see what the lower timeframes picture looks like.
Daily timeframe: The recently closed daily candle shows that the buyers attempted to come into the market yesterday from the low 9745, but found that the selling opposition was too strong around the 9906 area. In the event that the sellers continue to show strength here around the weekly swap level (level above), we feel there is a good chance that the market will decline and test a minor daily swap level seen at 9862 sometime today.
4hr Timeframe: The 4hr timeframe shows that there were clearly interested buyers around the 4hr demand area at 9683-9735, which consequently saw the market rally towards 9893 which was once again defended by the sellers.
It appears as though a consolidation has formed on the DAX between the two areas just mentioned above. For anyone who wishes to trade this range, we see tentative buys at 9743, and sells at 9880. However, we would recommend waiting for some sort of confirming price action on the lower timeframes rather than just setting pending orders here and hoping for the best, since fakeouts are common within ranging environments.
Assuming that price breaks below the range, which we think is more likely at the moment, we see a clear run down towards a daily decision-point demand area coming in at 9381-9524 (circled in red). This would give us ample reward to our risk if we shorted a retest down to here.

Current buy/sell levels:
- Buy orders: 9743 [Tentative] (Predicative stop-loss orders seen at: 9667).
- Sell orders: 9880 [Tentative] (Predicative stop-loss orders seen at: 9931).
DOW 30:
Weekly Timeframe: The DOW has been trading beautifully within a nice-looking trending channel for over five years, and shows no signs of slowing down just yet. The recently closed weekly candle informed us that the buyers once again remained in control. However, at this point in time, the current weekly candle is showing rather aggressive selling interest from 17972; let’s see what the lower timeframes have to say about this.
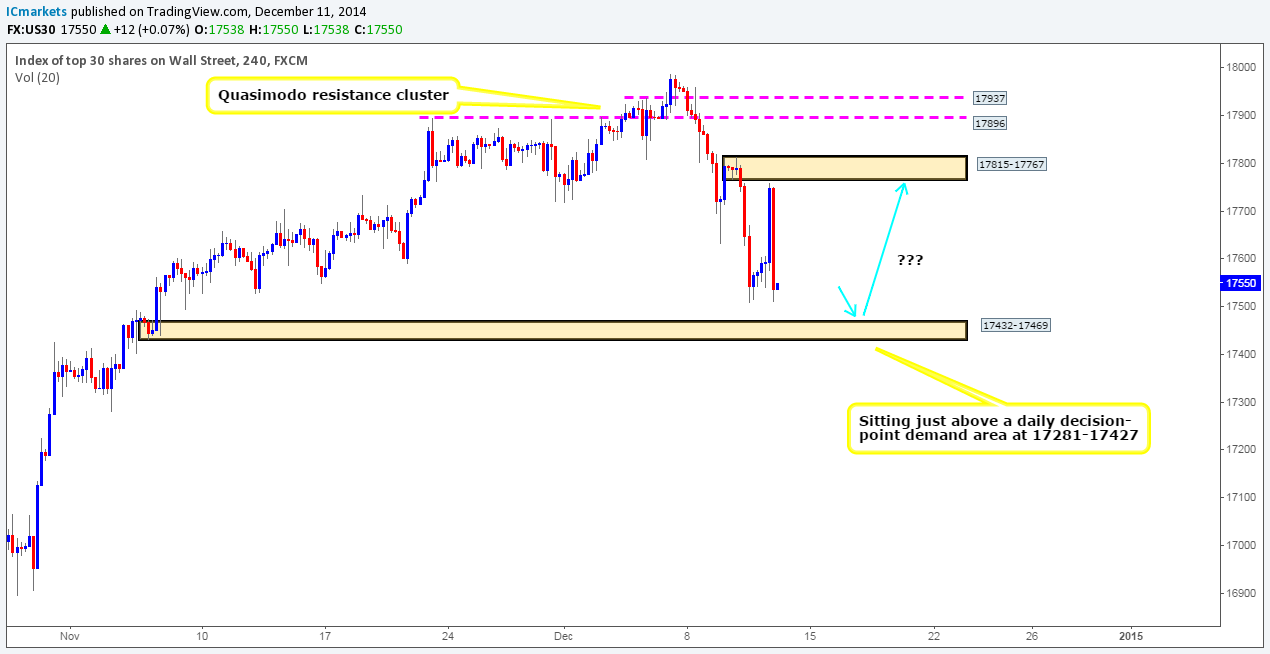
Daily Timeframe: It was mentioned in the previous analysis that price closed below a daily demand area seen at 17590-17689, and that we believed the path to be clear of support down until a daily decision-point demand area at 17281-17427. This still remains to be the case as a deep selling wick formed yesterday giving us extra confidence that the DOW is heading for a further decline.
4hr Timeframe: We have to be honest here; we did not expect the market to find support around 17508. Nevertheless, this could provide pro money a nice fake support to break. One can only imagine the amount of sell stops that are set a few points below this low. Imagine the liquidity pro money would gather (sell stops for their buys) by breaking this low into the small 4hr demand area seen at 17432-17469. This could provide a nice base in which to consider entering long from.
However, as mentioned in the previous analysis, we are a little concerned about this area’s validity simply because of the spike seen into it on the 06/11/14 at 17440, as this could have consumed serious buyers here. With that being said, we still feel there’s a good chance a reaction could be seen from here if price reaches here, and as such we are going to be watching for lower-timeframe buying confirmation around the 17481 mark with targets set above at 17756, just below a 4hr supply area at 17815-17767.
Current buy/sell levels:
- Buy orders: 17481 [Tentative] (Predicative stop-loss orders seen at: 17415).
- Sell orders: Flat (Predicative stop-loss orders seen at: N/A).
XAU/USD (Gold):
Weekly Timeframe: The weekly timeframe shows that Gold is currently being bought against the U.S Dollar, and as a result price is now trading just below a fresh weekly supply area coming in at 1255.20-1226.18.
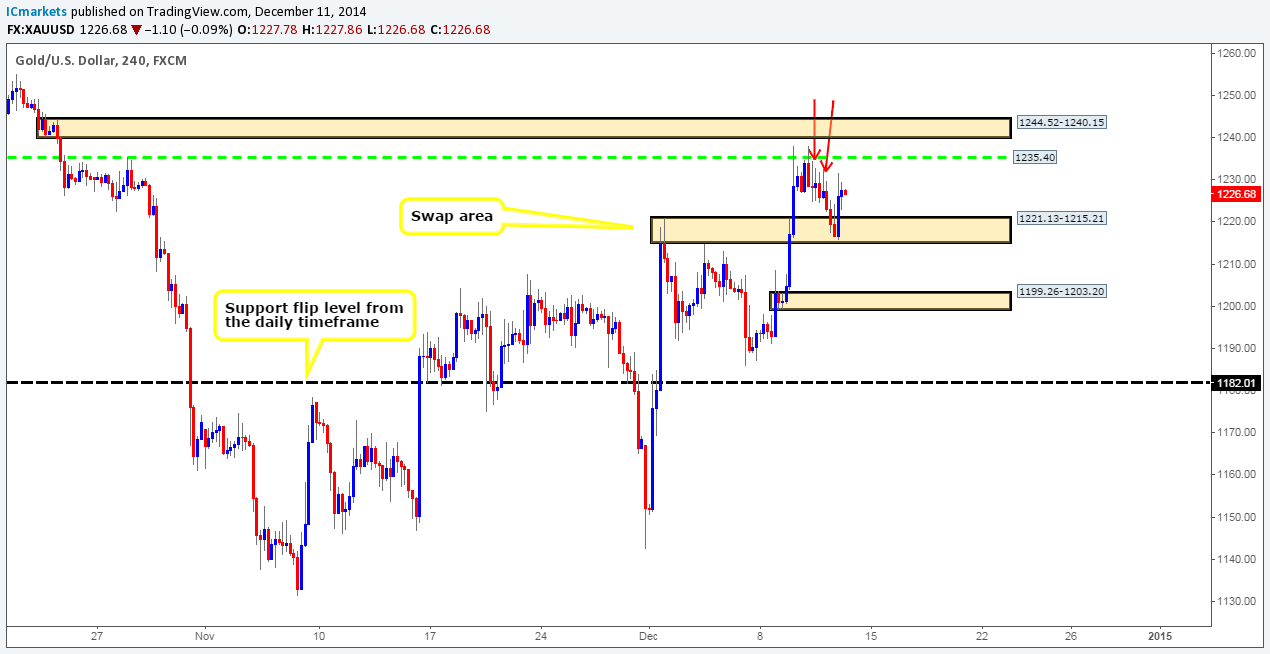
Daily timeframe: The daily timeframe shows that the recent buying momentum has forced prices above a daily decision-point supply area at 1235.51-1222.37 (located just within the aforementioned weekly supply area), which resulted in price forming two potential selling wicks. Yesterday saw the sellers attempt to trade lower, but price however were quickly rejected, resulting in a buying tail (1215.78) being formed. This gives us confidence that the two aforementioned wicks were likely consumption wicks and that a move higher may ensue, which sounds a dangerous thing to say considering price is currently trading below weekly supply at the moment (see above). It will be interesting to see what the 4hr timeframe has to say about this.
4hr Timeframe: The recent buying on Gold was seen from a 4hr swap area coming in at 1221.13-1215.21. As we just mentioned we feel that a move higher may be seen, and even after looking at the 4hr timeframe we still stand by that comment. The reasons why are as follows:
- Take a look at where price is trading now, just above is what we believe to be consumed supply marked with two red arrows, check out the supply consumption wicks seen at 1232.60/1234.58. This indicates that the path is relatively free for further buying.
- And two, take a look above 1235.40, and see that beautiful-looking fresh 4hr supply area at 1244.52-1240.15. This area is begging to be traded! What makes this so, is that pro money will likely look at faking above 1235.40 into this 4hr supply area to gather liquidity (buy stops) for a move south.
With the above taken into consideration, we have placed a pending sell order at 1239.32 (just below the aforementioned fresh 4hr supply area) in an attempt to catch the fakeout above 1235.40, with a stop-loss order set just above at 1246.67.
Current buy/sell levels:
- Buy orders: Flat (Predicative stop-loss orders seen at: N/A).
- Sell orders: 1239.32 (Predicative stop-loss orders seen at: 1246.67).
The post Friday 12th December: Daily technical outlook and review. appeared first on .
Source:: Friday 12th December: Daily technical outlook and review.


