
Previous Story
Friday 19th December: Daily technical outlook and review.
Posted On 18 Dec 2014
Comment: 0
EUR/USD:
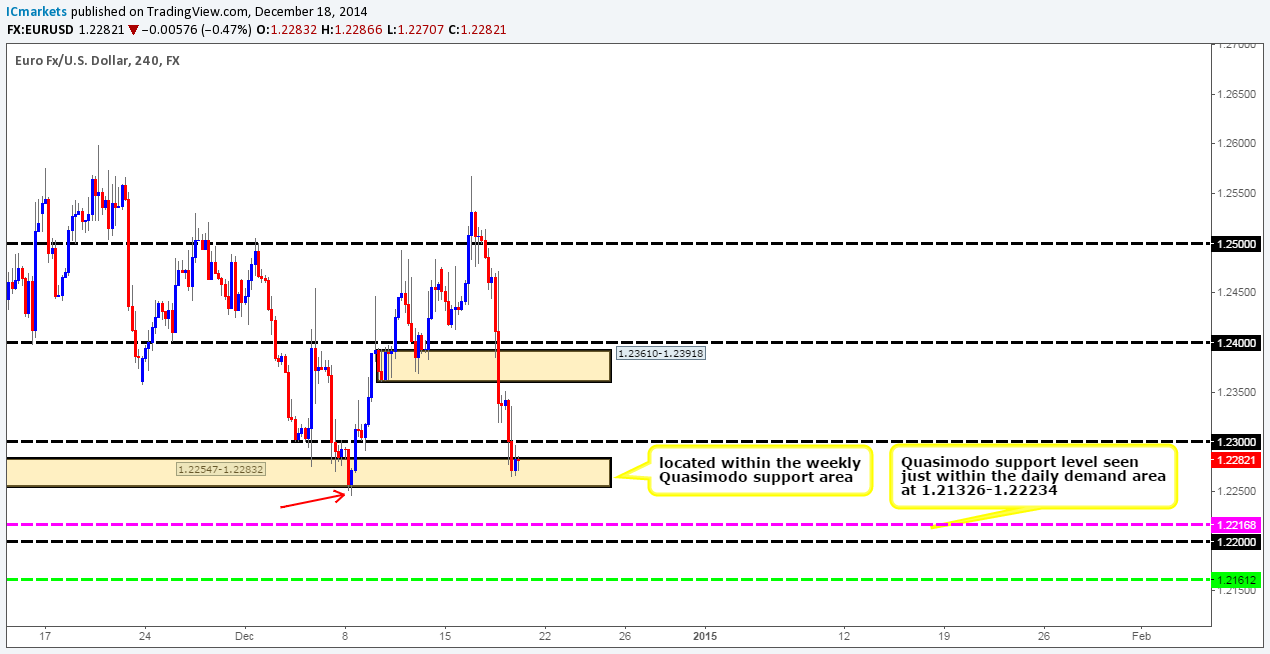
Weekly Timeframe: The weekly timeframe shows that the buyers and sellers are currently battling for position within a weekly Quasimodo support area seen at 1.22403-1.22942. For anyone considering shorting the Euro at the moment, you may want to consider that heavy-weight buying activity could very well be seen soon.
Daily Timeframe: The daily timeframe shows that a break below the aforementioned weekly Quasimodo support area would immediately hit a long-term daily demand area coming in at 1.21326-1.22234. Breakout sellers may benefit from knowing this.
4hr Timeframe: As expected, the 4hr demand area seen at 1.23610-1.23918 was indeed taken out. This resulted in further selling which consequently consumed the 1.23 number, and traded directly into a 4hr support area coming in at 1.22547-1.22832. Even though price is trading around higher-timeframe demand at the moment (see above), entering long here from a risk/reward perspective is a little too risky for our liking for two reasons:
- The 1.23 level could provide the market temporary resistance putting a halt on any buys.
- The 4hr support area mentioned above may well be weak. Check out the break (red arrow) seen on the 08/12/14 at 1.22460.
In the event that a break above 1.23 is seen today, we would then be confident enough to attempt to play the (possible) retest, looking to take first profits around 1.23557. On the other hand, if the sellers take it upon themselves to push the Euro lower, then this could be the ‘end of the road’ for the aforementioned weekly Quasimodo support area, and would likely attract follow-through selling down towards a 4hr Quasimodo support level seen at 1.22168 (located just within the daily demand area mentioned above at 1.21326-1.22234).
Current buy/sell levels:
- Buy orders: Flat (Predicative stop-loss orders seen at: N/A).
- Sell orders: Flat (Predicative stop-loss orders seen at: N/A).
GBP/USD:
Weekly Timeframe: The weekly timeframe shows that the buyers and sellers have been trading between a nice-looking weekly demand area at 1.54260-1.56110, and a weekly swap level seen at 1.57166 for the past four weeks now. A break above may see the buyers push higher towards 1.58934, another weekly swap level. And conversely, a break lower would likely attract further selling down towards a major weekly swap level coming in at 1.52700.
Daily Timeframe: The GBP/USD appears to be going nowhere in a hurry according to the daily timeframe. Since the 08/12/14, price has been sandwiched between the weekly swap level mentioned above at 1.57166, and a daily demand area seen at 1.54260-1.55378 (located relatively deep within the aforementioned weekly demand area). Let’s take a look on the 4hr timeframe to see what we can find.
4hr Timeframe: Since the 14/11/14, this pair has been trading within a down trending channel (1.56150/1.58247). A beautiful reaction was recently seen from the 4hr demand area at 1.55402-1.55627 (located just above the aforementioned daily demand area), which fuelled a break and retest of 1.56. We unfortunately missed this buying opportunity.
In our opinion, we have no concrete higher-timeframe direction at this point in time. And as a result all trades taken on this pair will require confirmation from the lower timeframes, and targets will be kept within reaching distance.
The only places we’d consider looking for short-term trades today would be around the 1.57 (tentative sell orders are seen just below at 1.56950) level, and at an average-looking 4hr supply area seen just above at 1.57849-1.57528 (tentative sell orders are seen just below at 1.57495). This area is particularly interesting since it not only has trendline confluence seen on the 4hr timeframe (see red circle); it is also located just above the weekly swap level mentioned above at 1.57166.
Current buy/sell levels:
- Buy orders: Flat (Predicative stop-loss orders seen at: N/A).
- Sell orders: 1.56950 [Tentative] (Predicative stop-loss orders seen at: dependent on where one confirms the level) 1.57495 [Tentative] (Predicative stop-loss orders seen at: 1.57892).
AUD/USD:
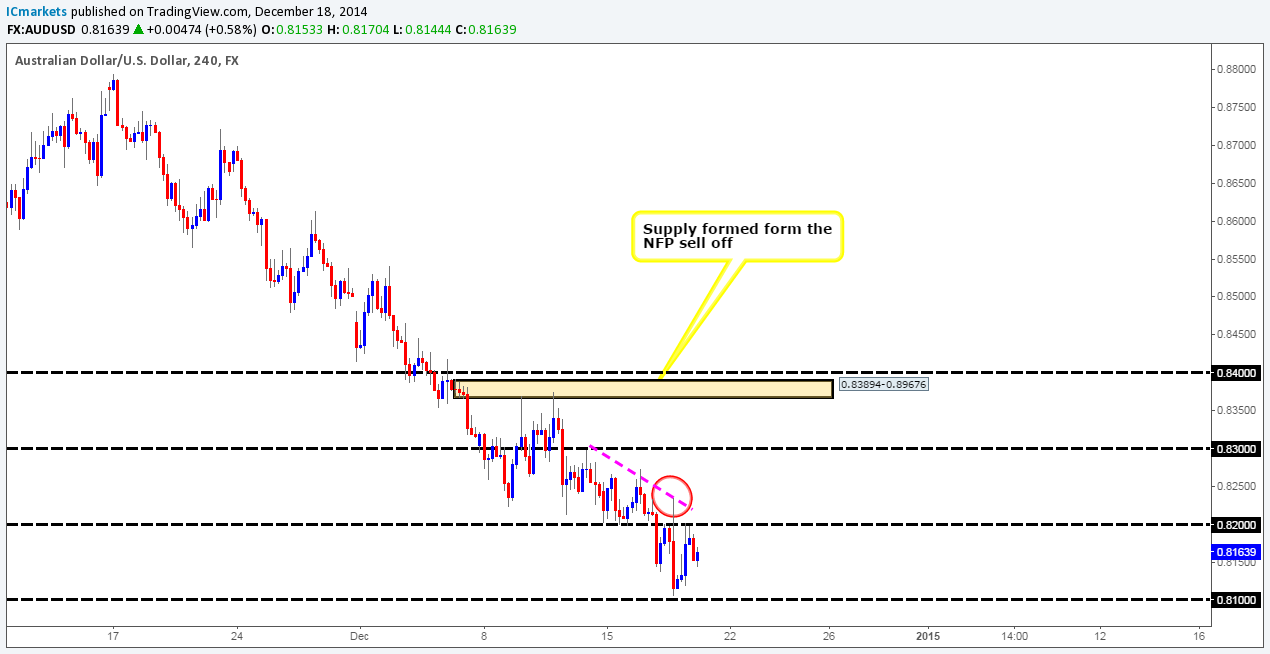
Weekly Timeframe: The USD continues to hammer the AUD deeper into major weekly demand at 0.80646-0.84601. A break below this area may promote further selling down towards a weekly demand area coming in at 0.76999-0.79740. Let’s see what the lower timeframes have to say about this.
Daily Timeframe: The daily timeframe currently shows that price is trading deep within a daily demand area at 0.80809-0.82270 (located deep within the weekly demand area mentioned above at 0.80646-0.84601), where at the time of writing a little buying interest has been seen. A break below here would likely clear the path south down towards a daily Quasimodo support area seen at 0.76999-0.78349 (located deep within the weekly demand area mentioned above at 0.76999-0.79740).
4hr Timeframe: Traders clearly found 0.81059 area a good place to buy the Aussie consequently fueling a rally higher up to 0.82, where at which point active selling was seen. We were not at our desks around this time, so we unfortunately missed the move north.
The recent developments seen on the AUD/USD has not changed our outlook. We know that from the higher timeframe analysis the overall bias for the Aussie is south at the moment, even though price is currently trading within higher-timeframe demand (see above) at the moment. We would only consider buying the Aussie if the market broke above the high circled in red at 0.82354, as the path north would then likely be clear up to at least 0.83. The reason being is simply because we believe there to be consumed supply to the left marked with a pink trend line – check out the supply consumption wicks at: 0.82354/0.82734.
Current buy/sell levels:
- Buy orders: Flat (Predicative stop-loss orders seen at: N/A).
- Sell orders: Flat (Predicative stop-loss orders seen at: N/A).
USD/JPY:
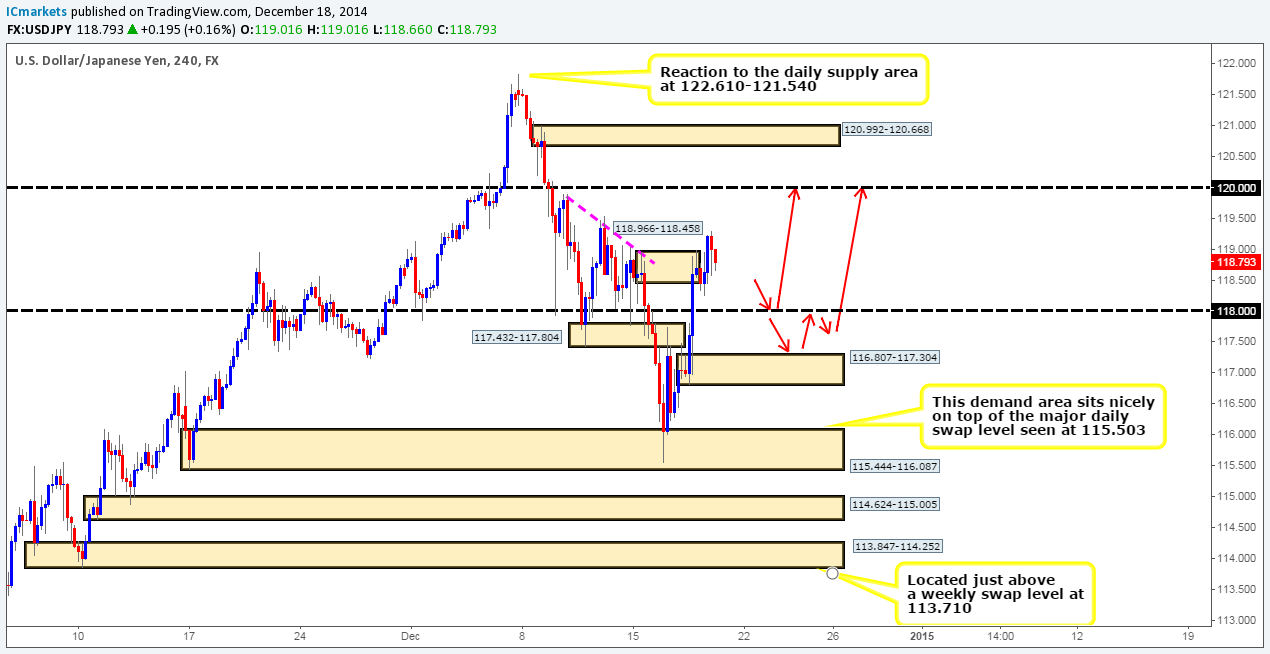
Weekly Timeframe: The weekly timeframe shows that the buyers are currently standing strong on a major weekly swap level at 115.503. In the event that further buying is seen from here, a test of the weekly Quasimodo resistance level seen at 122.180 may well happen.
Daily Timeframe: It was mentioned in the previous analysis that in order for the USD/JPY pair to continue rallying, a daily supply area seen at 119.196-118.041 would need to be consumed. Recent developments show that price has pushed above this area by a few pips. This move may have consumed some of the selling pressure here, and could in fact be all the buyers need to push prices higher towards a daily supply area coming in at 122.610-121.540 (encapsulates the aforementioned weekly Quasimodo resistance level).
4hr Timeframe: The 4hr supply area seen at 118.966-118.458 has (as far as we can see) been well and truly consumed, as reported may happen in the previous analysis.
The recent moves seen on this pair has likely cleared the path north for prices to at least challenge the huge psychological level 120, and given enough time, maybe the 4hr supply area seen above it at 120.992-120.668. The reason we believe prices could move this high is because of the (possible) consumed supply/sell orders seen to the left marked with a pink trendline, check out the supply consumption wicks seen at 118.966/119.046/119.546.
The above is all well and good, but the real question we all need an answer to is how do we trade this prospective move? We see two possible areas from where one could enter long from. The first is seen around the 118.073 mark, just above the round-number level 118. Lower-timeframe confirmation will be required here before pulling the trigger as we see no logical area for a stop-loss order. The second is seen lower down at 117.378, a little above a 4hr decision-point demand area at 116.807-117.304. We are relatively comfortable setting a pending buy order here, but remain aware of the fact that some resistance may be seen around 118 before prices continue north.
Targets for each trade will be set around 120, and 120.594.
Current buy/sell levels:
- Buy orders: Flat (Predicative stop-loss orders seen at: N/A).
- Sell orders: 118.073 [Tentative] (Predicative stop-loss orders seen at: Dependent on where one confirms the level) 117.378 (Predicative stop-loss orders seen at: 116.715)
USD/CAD:
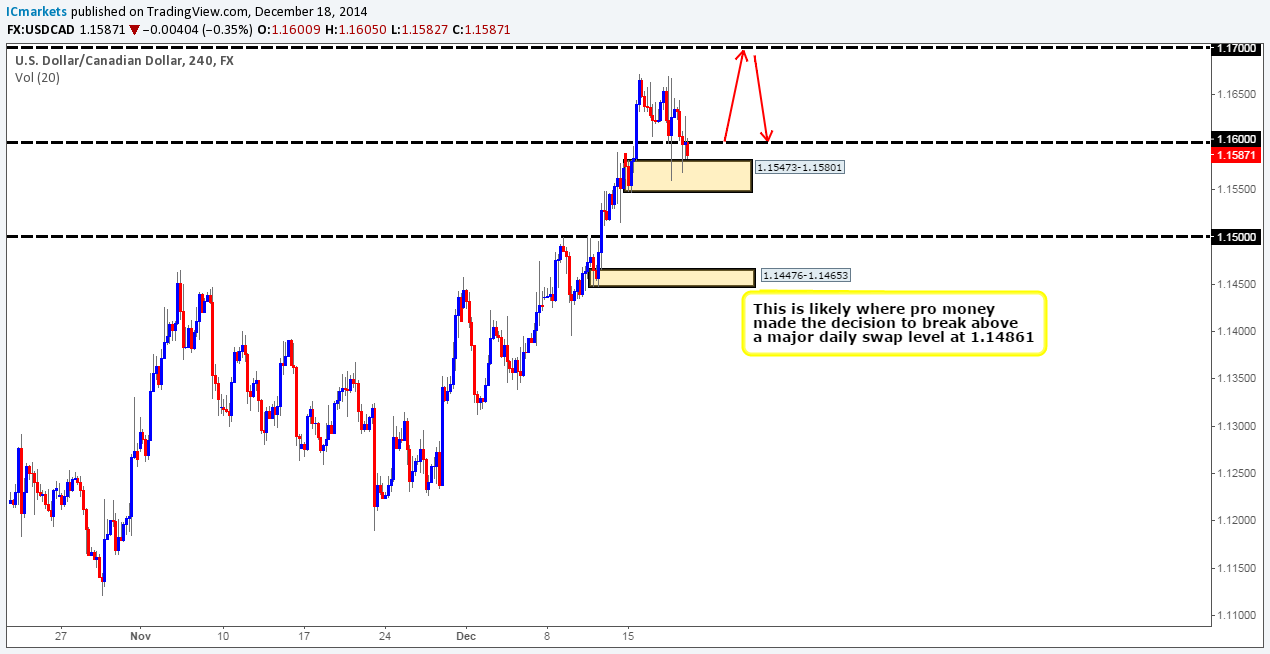
Weekly Timeframe: The weekly timeframe shows that the buyers and sellers are currently battling for position within a weekly supply area seen at 1.17225-1.15417 (surrounded by a larger weekly supply area seen at 1.18061-1.14739). It will be interesting to see what the lower timeframes show.
Daily Timeframe: The daily timeframe shows that the USD/CAD pair is trading between a daily supply area at 1.17225-1.16182 (located deep within the weekly supply area mentioned above at 1.17225-1.15417), and a daily channel trendline (prior resistance – 1.10807/1.13842). A close below could potentially force the market down towards a major daily swap level seen at 1.14861. Conversely, if the buyers can hold out here, and further buying is seen, then this could be an early signal that the weekly supply area mentioned above is weakening. Let’s see what the 4hr timeframe has to say about this.
4hr Timeframe: Technically, not much has changed on this pair, and as a result much of our previous analysis still remains valid. Price is currently challenging the 4hr demand area at 1.15473-1.15801 once again. If a break below here is seen, we believe we can all wave goodbye to the daily supply area mentioned above at 1.17225-1.16182, as the market will likely see a decline in value down to at least the 1.15 number (located just above a major daily swap level at 1.14861).
However, we feel there is a good chance that the USD may rally from here up towards 1.17 (located deep within both weekly and daily supply – see above) before a sell off is seen. It would be here where we’d become very interested in selling the U.S Dollar around the 1.16960 mark. Setting a pending sell order here would be too risky for us; we’d require some sort of confirmation from the lower timeframes before pulling the trigger, since round-number levels can sometimes suffer deep tests/spikes. First take-profit target for this trade would be set just above 1.16, as shown by the red arrows.
Expecting prices to rally when price is located in higher-timeframe supply (see above) may seem unwise, but in our experience, we have seen that the market really likes deep levels of support and resistance within higher-timeframe supply and demand areas.
Current buy/sell levels:
- Buy orders: Flat (Predicative stop-loss orders seen at: N/A).
- Sell orders: 1.16960 [Tentative] (Predicative stop-loss orders seen at: Dependent on where one confirms the level).
DAX 30:
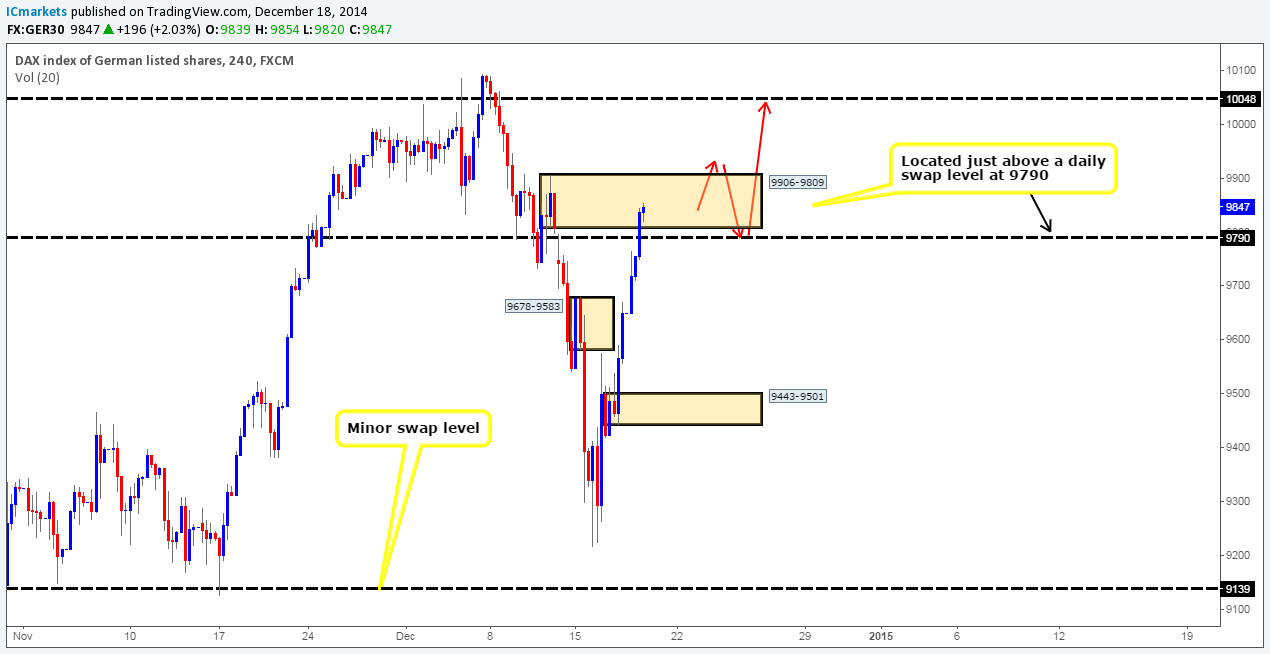
Weekly Timeframe: Active buying is currently being seen on the DAX from a weekly decision-point demand area at 9126-9467. Assuming that the buyers do not lose their spirit here, we could potentially see price test the all-time high 10090.
Daily Timeframe: The daily timeframe shows that the index has now rallied for three consecutive days, with yesterday’s action showing price closing (9847) above a daily swap level seen at 9790. In the event that the buyers can hold price above this swap level, we feel there is a good chance a continuation move will be seen up towards a daily resistance zone at 10048-10007 sometime soon.
4hr Timeframe: The 4hr timeframe shows that once the market opened at 9651 yesterday, price completely ignored the 4hr supply area seen at 9678-9583, and traded directly towards another 4hr supply area coming in at 9906-9809. That being the case, for further buying to be seen up to the daily resistance zone mentioned above at 10048-10007, this area of supply will need to be consumed.
This is how we see the market moving today: price will likely see ranging action within the current 4hr supply for a few hours after the open, simply because there’s no doubt a lot of sell orders to chew through. Following this, a push higher will likely be seen above supply, this will trigger the last remaining stops, and trap any breakout buyers. Finally, we believe a sharp selloff will be seen down to the daily swap level mentioned above at 9790, which is where we’ll be looking to enter long with lower-timeframe confirmation, targeting around 10048, as per the red arrows.
Current buy/sell levels:
- Buy orders: Flat (Predicative stop-loss orders seen at: N/A).
- Sell orders: Flat (Predicative stop-loss orders seen at: N/A).
DOW 30:
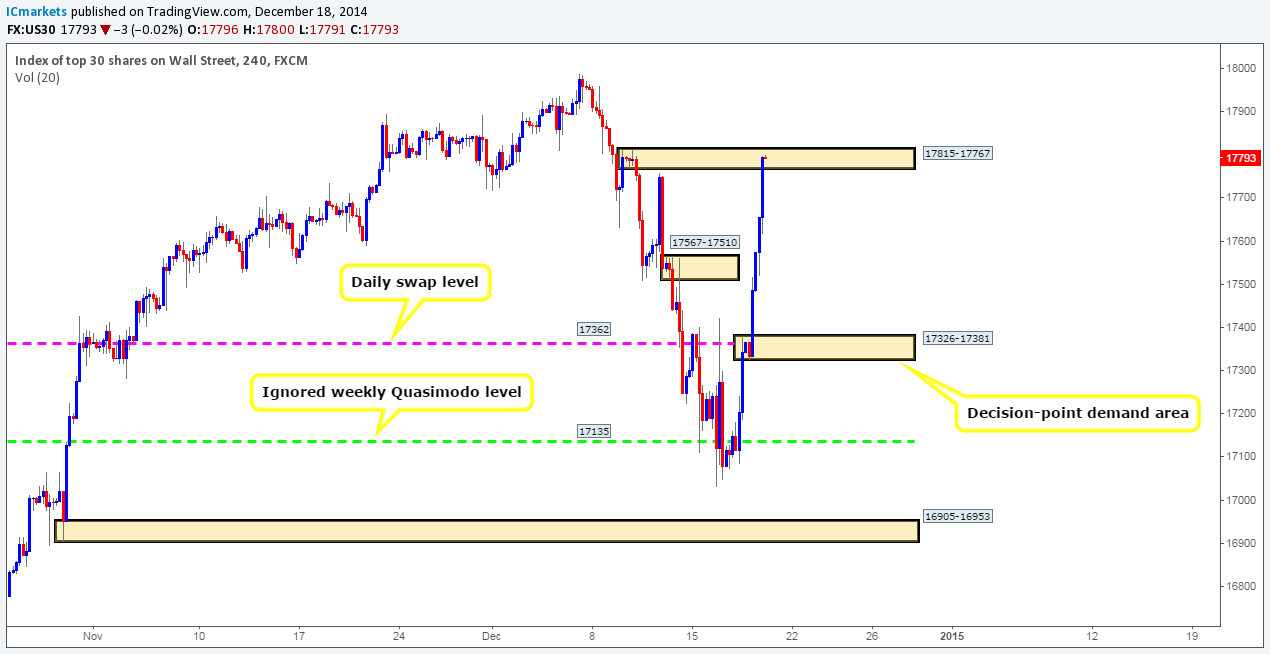
Weekly Timeframe: Serious buying interest is currently being seen off an ignored weekly Quasimodo resistance level at 17135. Will the buyers have enough steam to break the high 17988? Let’s take a look on the lower timeframes to see what we can find.
Daily Timeframe: The daily timeframe shows that the market rallied 451 points (figure includes pre/after market hours) – simply dreamy for anyone long this index at the moment. Providing that the buyers do not run out of gas here, we see very little from stopping price rallying up to at least a daily Quasimodo resistance level seen at 17893.
4hr Timeframe: In the daily timeframe analysis section, we mentioned that we see very little stopping prices from rallying. However, after looking at the 4hr timeframe, it changes things slightly. Buyers and sellers are currently seen battling for position within a small fresh 4hr supply area seen at 17815-17767. The buyers will need to consume any selling opposition around this supply in order for the market to rally up to the aforementioned daily Quasimodo resistance level.
Shorting here is something we would not be comfortable doing, especially with the aggressive buying recently seen. Assuming that price breaks higher and retests the current 4hr supply as demand, entering long here would not really leave much room for profit if one were to target 17893.
Therefore, given the points made above, we are going to remain flat for the time being, and watch how price action unfolds later on today.
Current buy/sell levels:
- Buy orders: Flat (Predicative stop-loss orders seen at: N/A).
- Sell orders: Flat (Predicative stop-loss orders seen at: N/A).
XAU/USD (Gold):
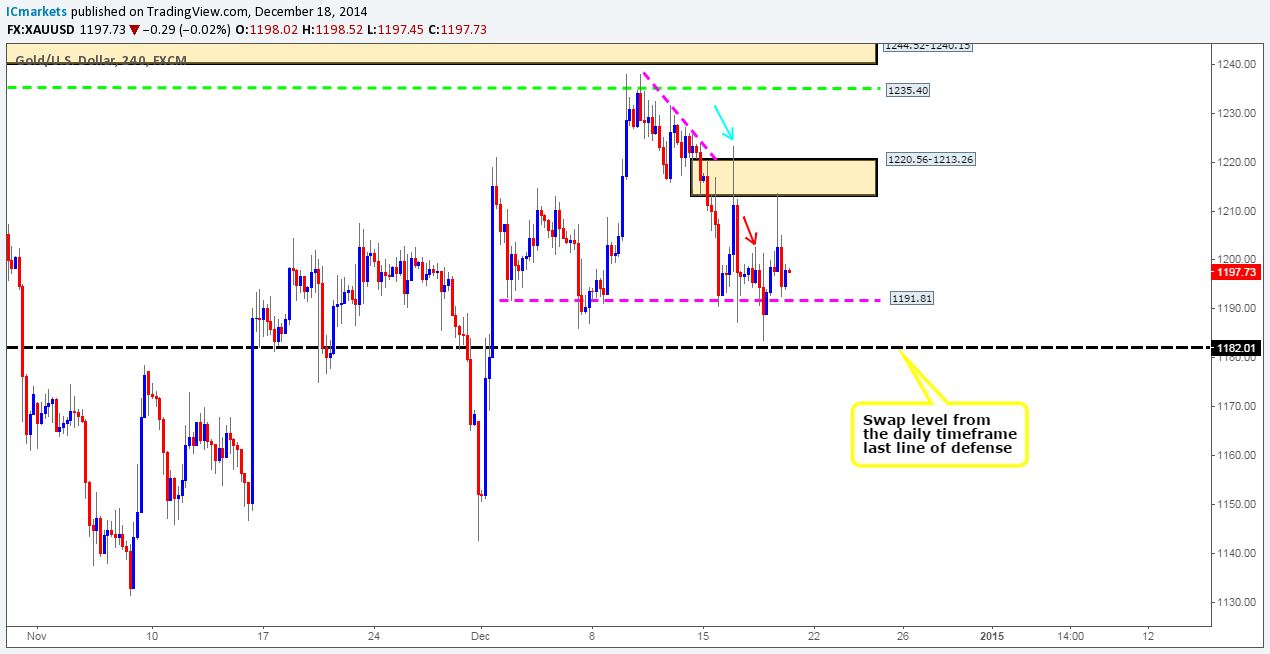
Weekly Timeframe: The weekly supply area seen at 1255.20-1226.18 seems to be proving itself as an important zone to watch out for. Assuming that further selling is seen from here, it is likely that we may see another test of 1136.30, a weekly decision-point demand level.
Daily Timeframe: The daily timeframe shows that the buyers are still struggling to maintain support within the daily decision-point demand area at 1185.97-1203.20. A small spike/tail was seen below here on Wednesday, consequently hitting a major daily swap level coming in at 1182.01. This in our opinion is the last line of defense against the aforementioned weekly supply area; a daily close below here would effectively expose 1149.42 which in turn could likely fuel further selling. Let’s take a look to see what the 4hr timeframe has to say about this.
4hr Timeframe: It was mentioned in the previous analysis that if prices were to break above the high marked with a red arrow at 1202.81, we would begin looking for areas to enter long at.
As we can see this has indeed happened, and we are currently watching the 15 minute timeframe for an entry long around the 4hr Quasimodo support level seen at 1191.81. In the event that we do find a long entry here sometime today, our overall target will be set around 1234.44, just below a 4hr swap level coming in at 1235.40.
As already mentioned in the previous analysis, the reason behind us believing price could move so high is simply because selling opposition has already likely been consumed (blue arrow) around the 4hr supply area seen at 1220.56-1213.26, and in addition to this, lurking just above this area of supply is what we believe to be consumed sell orders/supply as well (pink downtrend line). Check out the price behavior here, we see this as pro money spiking north to collect unfilled sell orders to continue selling, but what this also does at the same time is clear the path north for future buying .
Current buy/sell levels:
- Buy orders: Presently watching the lower-timeframe action for buy trades around a 4hr Quasimodo support level at 1191.81 (Predicative stop-loss orders seen at: N/A).
- Sell orders: Flat (Predicative stop-loss orders seen at: N/A).
The post Friday 19th December: Daily technical outlook and review. appeared first on .
Source:: Friday 19th December: Daily technical outlook and review.


