
Previous Story
Friday 7th November: Fasten your seatbelts – it is NFP day today!
Posted On 07 Nov 2014
Comment: 0
EUR/USD:
Weekly Timeframe: The weekly timeframe shows that the Euro continues to be sold against the U.S Dollar. As a consequence of this, price has been forced deeper into a combined weekly demand/Quasimodo support area coming in at 1.22403-1.24420/1.22866.
Daily Timeframe: The daily demand area seen at 1.22462-1.25616 has been well and truly consumed, which as a result attracted further selling down to another fresh daily demand area coming in at 1.22877-1.23809 (located within the aforementioned weekly demand/Quasimodo support area). Since both the higher timeframes are showing that price is trading around demand at the moment, let’s take a look at the 4hr timeframe to see if there are any logical entries to buy this market.
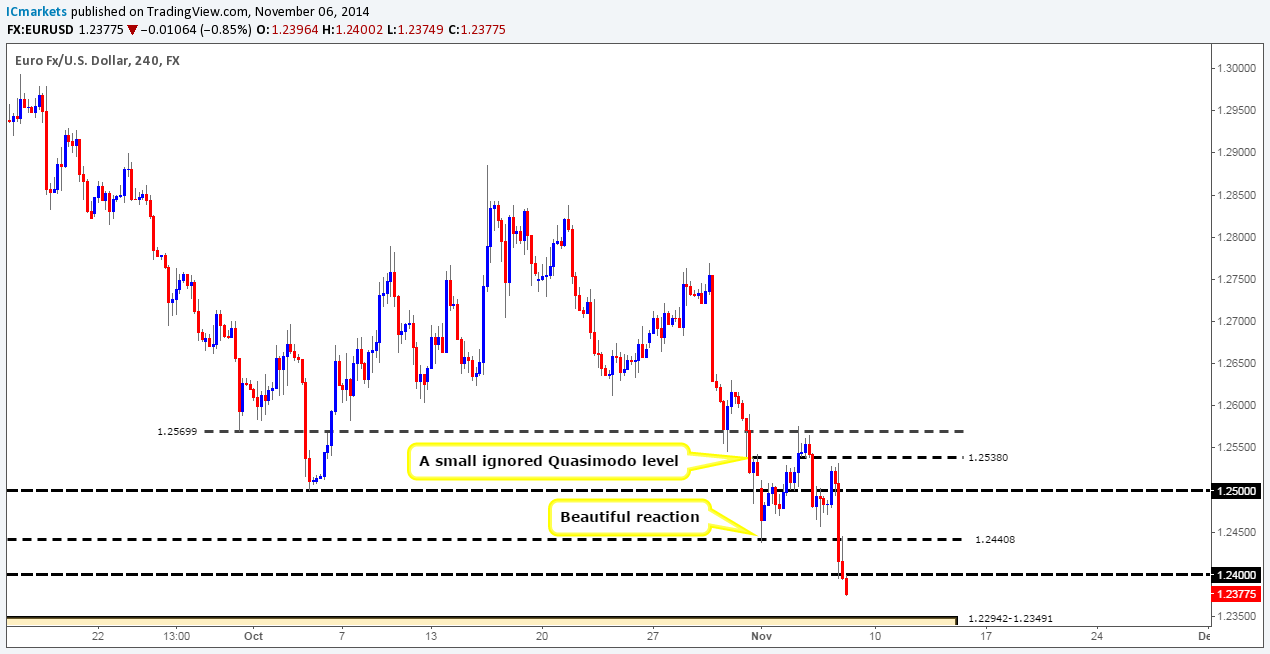
4hr Timeframe: Yesterday’s price action shows that the market broke above 1.25, and just missed the ignored Quasimodo resistance level at 1.25380 before dropping like a rock. This momentum south broke through not only the aforementioned round number, but also the 1.24408 level, and just recently the round number 1.24.
We feel that there is a good chance further selling will be seen on the Euro today down towards a combined 4hr demand/round-number area at 1.22942-1.23491/1.23 (buying interest is expected to enter the market just within this zone around 1.23069). This area has extra weight in our opinion simply because price is currently trading deep within major demand on the higher timeframes (see above) at the moment. However, if anyone is considering going long around this area, please do bear in mind that high volatility is expected with the NFP numbers due out today, and stop-loss orders should be used. Targets for this long trade are seen around 1.23954/1.24344. Good luck today.
Buy/sell levels:
- Buy orders: 1.23069 (Predicative stop-loss orders seen at: 1.22466).
- Sell orders: N/A (Predicative stop-loss orders seen at: N/A).
GBP/USD:
Weekly Timeframe: The weekly timeframe shows that the British pound has taken a tumble, which has resulted in the weekly demand area seen at 1.58533-1.60157 seeing a break. This move potentially opens the gates for price to challenge 1.57166; a strong-looking weekly resistance flip level.
Daily Timeframe: Price is currently trading around a small rally base rally demand area at 1.57736-1.58390 on the daily timeframe. Assuming the buyers can hold out above here, this could potentially encourage further buying giving the impression that the weekly demand area (levels above) was faked out for higher prices. It will be interesting to see what the NFP brings to this market.
4hr Timeframe: The huge psychological number 1.6 was clearly enough to hold the market lower, as price was aggressively sold from here. This move has broken through 1.59, and has potentially cleared the path down to around a 4hr demand area at 1.57736-1.58110 (located deep within the aforementioned daily rally base rally demand area). We do believe there are active buyers waiting around this 4hr area of demand (1.58352), with that being said though; we are more inclined to wait for lower-timeframe confirmation here. The reason for this is because the weekly chart shows that the market has the potential to decline further (see above), and with the NFP announcement due later today, we do not think it is worth the risk placing a pending order, and hoping for the best.
Buy/sell levels:
- Buy orders: 1.58352 [Tentative] (Predicative stop-loss orders seen at: 1.57684).
- Sell orders: N/A (Predicative stop-loss orders seen at: N/A).
AUD/USD:
Weekly Timeframe: The weekly timeframe shows that price has aggressively broken below a weekly demand area coming in at 0.86591-0.88247. Assuming that further selling is seen here, we can likely expect price to test the huge weekly demand area looming below at 0.80646-0.84601.
Daily Timeframe: As a consequence of the aggressive selling that has been seen on the Aussie recently, price was forced out of a medium-term daily range (0.86318-0.87183/0.88961-0.88302) down towards a significant daily resistance flip level seen at 0.85504. Let’s see what we can find on the 4hr timeframe.
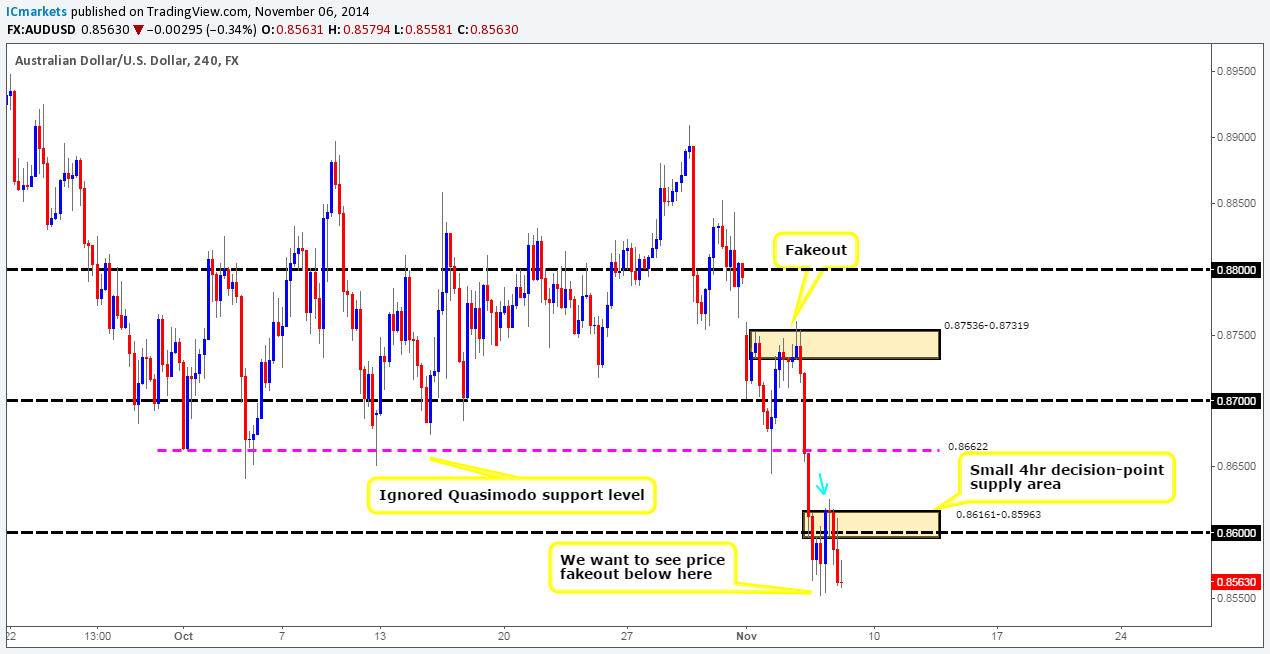
4hr Timeframe: Unfortunately, the historical data on this feed does not allow us to see what the 4hr timeframe price action looks like in the past. Nonetheless, we know that price has broken below a weekly demand area at 0.86591-0.88247, and is at the time of writing seen reacting off of a daily resistance flip level at 0.85504. So, we can work from there.
The 4hr timeframe may present a long opportunity if the low 0.85522 is faked out; this will only be seen if the big boys want to collect sell stops to buy into (liquidity). The reasoning behind this trade would be as follows:
- Price is trading around a historical resistance flip level on the daily timeframe at 0.85504 giving this trade extra weight.
- Price has consumed the 4hr decision-point supply area at 0.86161-0.85963, which in turn likely signals that the market wants higher prices up to around 0.86622, a Quasimodo level.
However, anyone considering taking this trade must keep in mind that the weekly timeframe is showing that we may see a further decline in prices (see above), and also not forgetting that the markets will likely be volatile today, so be sure to use stop losses, and abide to them!
Buy/sell levels:
- Buy orders: N/A (Predicative stop-loss orders seen at: N/A).
- Sell orders: N/A (Predicative stop-loss orders seen at: N/A).
USD/JPY:
Weekly Timeframe: The weekly timeframe shows that price has broken above a major weekly supply area seen at 114.650-112.530. As per this timeframe, the path north appears to be relatively free up to another major weekly supply area coming in at 117.931-116.799. Let’s see what the lower-timeframe picture looks like.
Daily Timeframe: Of course, with the weekly supply area (114.650-112.530) recently being taken out, the small daily supply area (114.650-113.963) located within was obviously going to be consumed as well. With that being said, the daily timeframe shows that a minor daily Quasimodo resistance area is sitting just above the weekly supply area (114.650-112.530) at 115.911-115.021, could this be a nice level for pro money to fake into and fool a whole heap of traders on direction??? Let’s take a look to see what we can find on the 4hr timeframe.
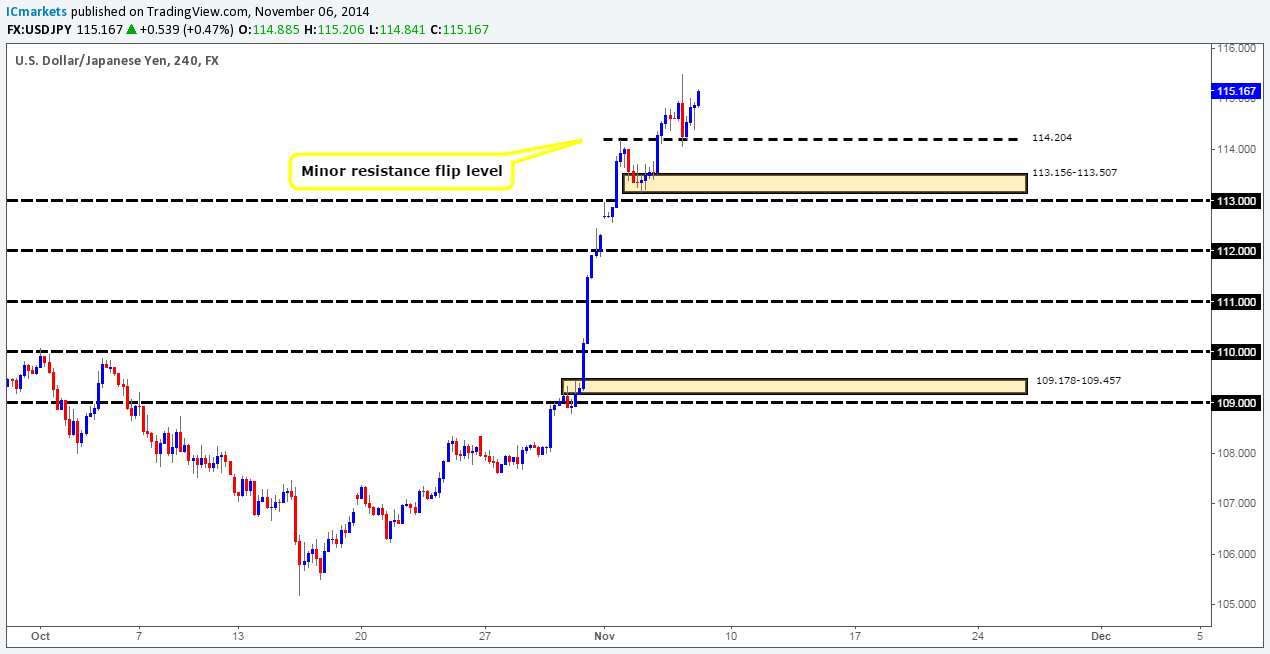
4hr Timeframe: The 4hr timeframe shows that price held above 114.204 beautifully, which resulted in further buying of the U.S dollar. We do hope some of our readers got in on this move.
The historical data is not allowing us to see what the price action to the far left is like, so we’ll have to make do with what we currently have. We know that price has broken above major weekly supply at 114.650-112.530, but we can also see that price is trading around a daily Quasimodo resistance area at 115.911-115.021 just above as well. The upward momentum seen on this pair is showing no signs of slowing down just yet. In fact, with the NFP due out today, this could fuel further buying dependent upon positive numbers being announced of course. For the time being we do not see any safe entries on this pair, and as such we will remain flat and see how this market develops towards the close.
Buy/sell levels:
- Buy orders: N/A (Predicative stop-loss orders seen at: N/A).
- Sell orders: N/A (Predicative stop-loss orders seen at: N/A).
EUR/GBP:
Weekly Timeframe: Price remains trading relatively deep within a weekly demand area seen at 0.76931-0.78623. Nevertheless, considering where price is currently located, we have not seen much in the way of buying strength over the past few weeks. Let’s see what the lower timeframes have to say about this.
Daily Timeframe: For the time being, it seems that price is consolidating between a daily supply area seen at 0.79109-0.78609, and a daily demand area at 0.77507-0.77772 (located deep within the aforementioned weekly demand area). Once one of the above areas is consumed, this will provide us with vital information as to where price will likely trade to next.
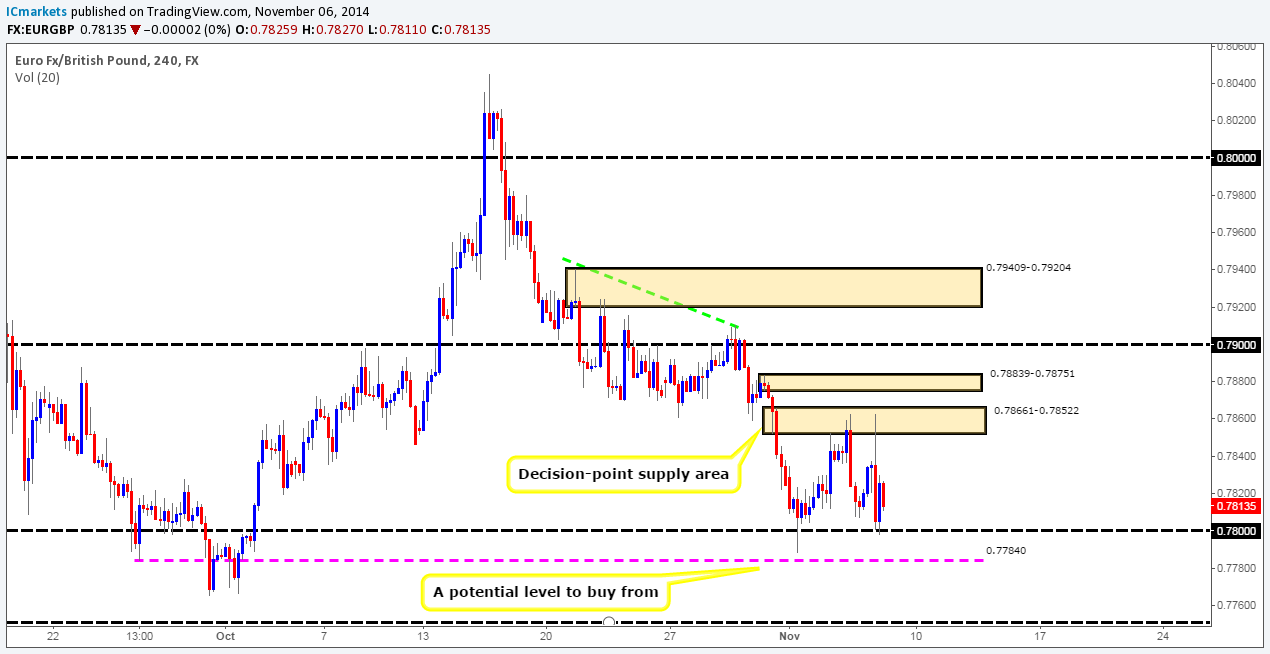
4hr Timeframe: The 4hr timeframe shows that the 4hr decision-point supply area at 0.78661-0.78522 (located just within the aforementioned daily supply area) was tested once again yesterday, which repelled the market beautifully. The reaction from here forced price back down to the round-number level 0.78, where at which point active buying came into the market.
In the event that the sellers can overcome any buying pressure seen around the 0.78 hurdle, we will very likely see the market drop down towards 0.77840, a 4hr Quasimodo support level. It would be here where we would become very interested in buying the Euro around 0.77867. Be that as it may, we would need lower timeframe confirmation here, since the higher timeframe picture is not exactly showing much in the way of buying strength at the moment (see above).
Buy/sell levels:
- Buy orders: 0.77867 [Tentative] (Predicative stop-loss orders seen at: 0.77637).
- Sell orders: N/A (Predicative stop-loss orders seen at: N/A).
USD/CAD:
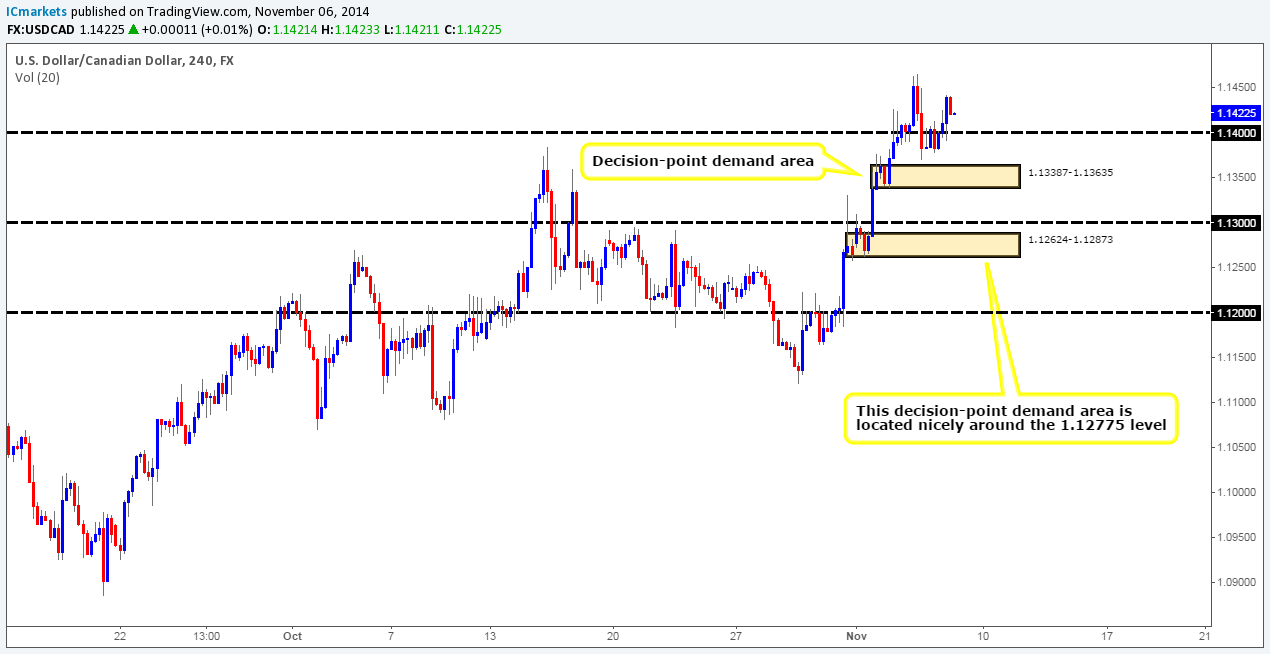
Weekly Timeframe: The weekly timeframe shows that price is currently trading above the medium-term weekly high 1.12775. Ultimately, we would like to see the current weekly candle firmly close above this level, as this would likely confirm that higher prices may be seen up to around a weekly supply area coming in at 1.17225-1.15417.
Daily Timeframe: Price is currently holding above the high 1.13842 as support on the daily timeframe; this may in itself provide a nice base to go long from. However, at the same time we also have to be prepared for this level to break, and further selling to be seen down to test the more obvious medium-term weekly high 1.12775 as support. Let’s see what we can find on the 4hr timeframe.
4hr Timeframe: The 4hr timeframe is showing that price was unable to hold below 1.14, which resulted in the buy orders lurking just above the 4hr decision-point demand area (1.13387-1.13635) at 1.13671 (order has been changed to 1.13489 – see below) being left unfilled.
The low 1.13699 is a perfect level to be faked. Lots of traders on the lower timeframes will be watching this as an area/level to go long from, which pro money is surely aware of. What the majority of the lower timeframe traders do not do is take into account the higher timeframes, if they did, they would see the aforementioned 4hr decision-point demand area looming just below. So with this in mind, we feel that a hard push south will be seen today past both the round number 1.14 and the low just mentioned. From here the market will likely meet active buyers around 1.13489 (within the aforementioned 4hr decision-point demand area). This move will likely be fueled by the NFP announcement today, but this will of course be dependent on the results. We would also advise waiting for some confirmation on the lower timeframes before entering long there, as we mustn’t forget that price could indeed continue lower to test the medium-term weekly high (1.12775) as support, which is nicely located around the 4hr decision-point demand area seen below at 1.12624-1.12873 (active buy orders are seen just above at 1.12916).
Buy/sell levels:
- Buy orders: 1.12916 (Predicative stop-loss orders seen at: 1.12534) 1.13489 [Tentative] (Predicative stop-loss orders seen at: 1.13314).
- Sell orders: N/A (Predicative stop-loss orders seen at: N/A).
USD/CHF:
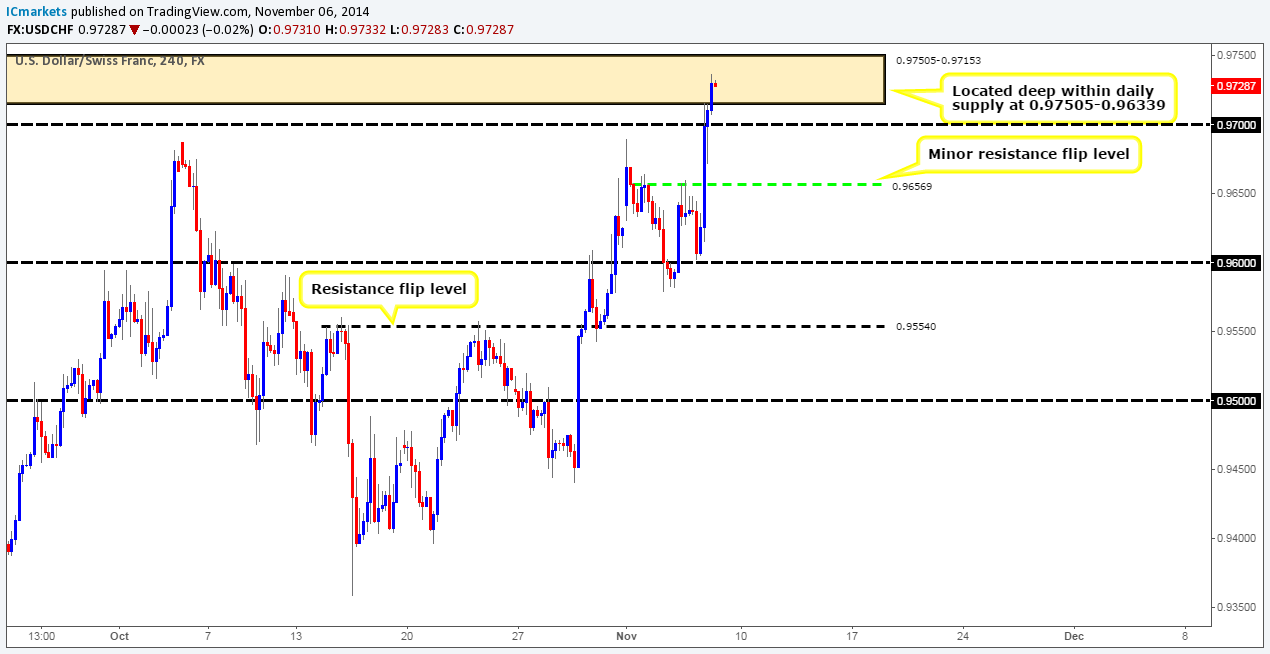
Weekly Timeframe: The weekly timeframe still shows price is capped between a weekly supply area coming in at 0.98378-0.95895, and a weekly resistance flip level seen at 0.94546. With that being said, at the time of writing most of the trading action is taking place within the aforementioned weekly supply area with the buyers seen in overall control.
Daily Timeframe: Yesterday saw a seriously bullish day, as the buyers pushed price 135 pips higher within a major daily supply area coming in at 0.97505-0.96339 (located within the aforementioned weekly supply area). It will be interesting to see what we can find on the 4hr timeframe.
4hr Timeframe: We have to be honest here; we thought that price would decline further than 0.96022 from 0.96606, we were expecting at least 0.95540, maybe a little too ambitious here! Anyone who got long around the round-number level 0.96 will likely have a big smile on their face right now, fantastic risk to reward on that trade, well done.
Price is currently trading within a 4hr supply area seen at 0.97505-0.97153, located very deep within the aforementioned daily supply area. Risk/reward considerations argue against shorting this market for the time being, since price is too close to potential support seen around 0.97. We would however become interested sellers if price were to successfully consume some or most of the buyers around the 0.97 level, as this would likely imply the market could potentially drop down to at least 0.96569, a minor 4hr resistance flip level.
With no confirmed direction seen on this pair, we have decided to remain flat for the time being. However, if a short-term sell opportunity presents itself post NFP, we will gladly take advantage of it.
Buy/sell levels:
- Buy orders: N/A (Predicative stop-loss orders seen at: N/A).
- Sell orders: N/A (Predicative stop-loss orders seen at: N/A).
XAU/USD (GOLD):
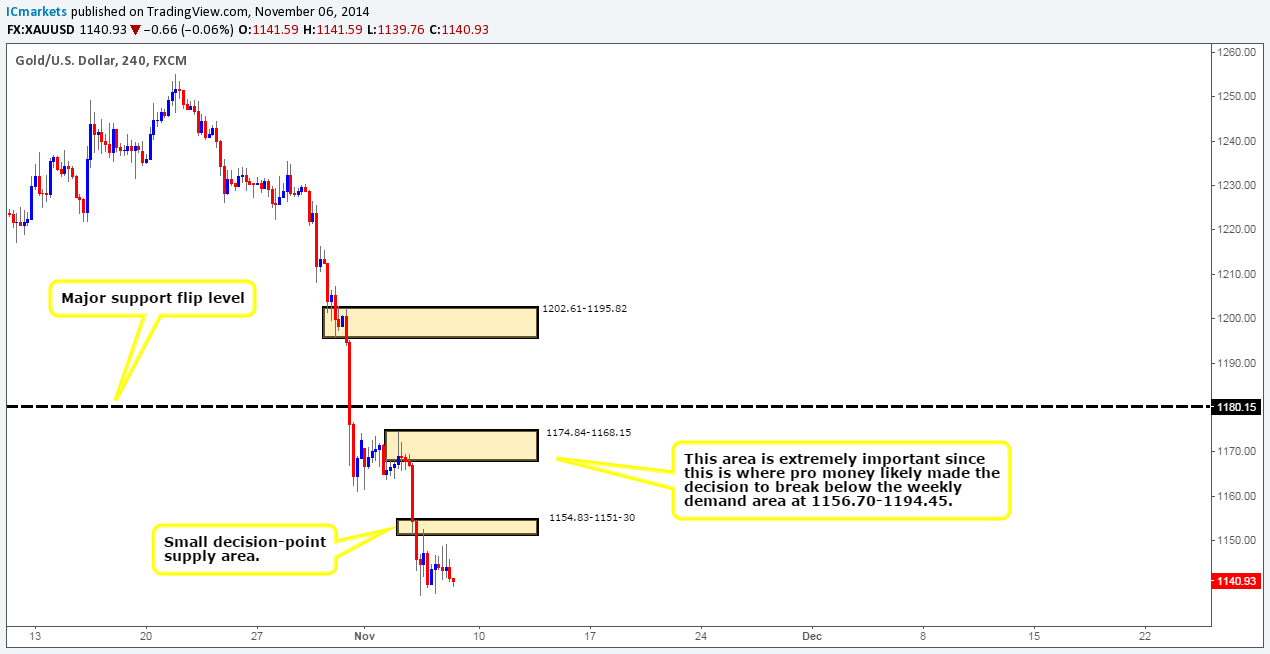
Weekly Timeframe: The weekly timeframe shows that price has broken below a weekly demand area at 1156.70-1194.45, which as a consequence forced further selling down towards a small weekly decision-point demand level coming in at 1136.30.
Daily Timeframe: The daily demand area at 1156.70-1166.05 was obviously consumed as well considering it was located deep within the aforementioned weekly demand area. This move has very likely opened the gates for price to challenge the daily demand area seen at 1101.60-1114.64. Why do we think price could drop that far? Take a look to the left of current price and take note of how most of the demand appears to have already been consumed by the demand consumption tails seen at 1156.04/1145.59/1131.64/1123.69.
4hr Timeframe: The 4hr timeframe shows just how stagnant gold has become over the last two days. Price continues to range between 1140.27 and 1147.29. As a consequence of this, much of our previous analysis still remains valid. Most of our regular readers already know that for the time being we are unable to see the historical 4hr timeframe data on this feed. Nonetheless, we know that price is currently trading around a weekly decision-point demand level (1136.30) at the moment, and that the daily timeframe is showing signs of a further decline is on the cards (see above). So, let’s work from there.
With the above in mind, we will be watching the lower timeframe price action to see if there are any long entries around the aforementioned weekly decision-point demand level. Ultimately, what we’re looking at is for price to break above a small 4hr decision-point supply area seen at 1154.83-1151.30, once/if this happens we can begin looking for buys targeting 1167.37, just below the 4hr decision-point supply area at 1174.84-1168.15.
We have not ignored the daily-timeframe analysis, just for the time being the weekly timeframe in our opinion should take precedence. Until the weekly demand level breaks negating a bullish bias, we will be focusing on looking for longs at this point in time.
Buy/sell levels:
- Buy orders: N/A (Predicative stop-loss orders seen at: N/A).
- Sell orders: N/A (Predicative stop-loss orders seen at: N/A).
Source:: Friday 7th November: Fasten your seatbelts – it is NFP day today!


