
Previous Story
Gold analysis for March 06, 2017
Posted On 06 Mar 2017
Comment: 0
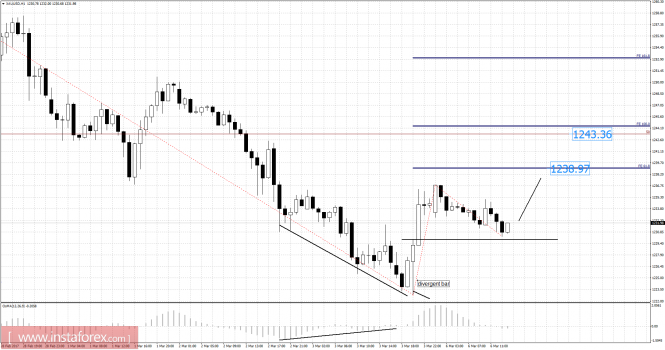
Recently, Gold has been trading downwards. As I expected, the price tested the level of $1,229.97. According to the 1H time frame, I found a bullish divergence on the moving average oscillator, which is a sign that selling looks risky. There is also a divergent bar, which is another sign of a potential strength. My advice is to watch for potential intraday buying opportunities. I have placed Fibonacci expansion to find potential targets. The first target is set at the price of $1,239.00 and the second target is set at the price of $1,243.35.
Resistance levels:
R1: $1,237.40
R2: $1,238.50
R3: $1,240.25
Support levels:
S1: $1,233.85
S2: $1,232.75
S3: $1,230.95
Trading recommendations for today: watch for potential buying opportunities due to bullish divergence in the background.
The material has been provided by InstaForex Company – www.instaforex.com
Source:: Gold analysis for March 06, 2017


