
Previous Story
Ichimoku indicator analysis of gold for June 28, 2017
Posted On 28 Jun 2017
Comment: 0
Gold price might have made an important low last week and needs to hold above it. Next sign of strength will be to break above $1,260 and the most important resistance for bulls to break, will be the $1,300 area of the previous double top.
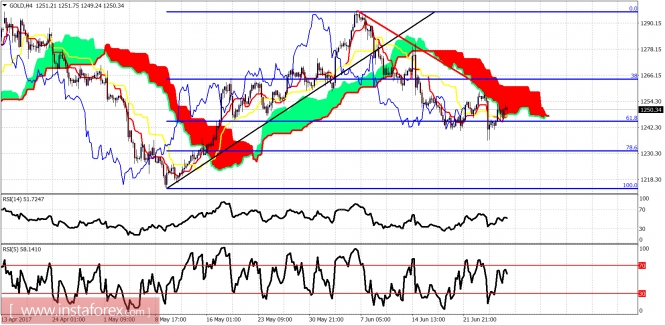
Red line – short-term resistance trend line
Gold price is still trading below the Ichimoku cloud in the 4 hour chart. Price holds above the 61.8% Fibonacci retracement and it shows signs of a possible bullish reversal from current levels. Short-term resistance at $1,260. Support at $1,235.
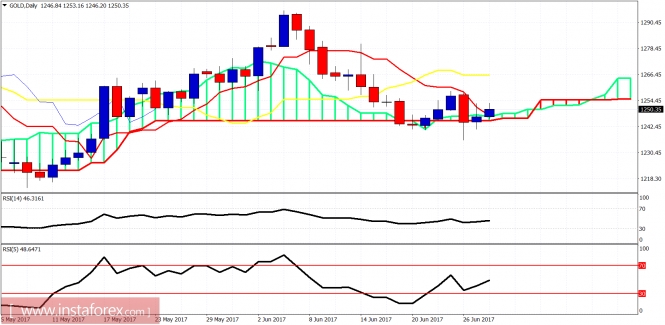
On a daily basis Gold price is holding above the Kumo and this is a bullish sign. The RSI (5) is also turning upwards which is a bullish sign. Next important daily resistance is at $1,266. If broken we will test the double top at $1,290-$1,300. If however break below the cloud, we should expect $1,200 to be tested. I remain longer-term bullish.The material has been provided by InstaForex Company – www.instaforex.com
Source:: Ichimoku indicator analysis of gold for June 28, 2017


