
Previous Story
Ichimoku indicator analysis of USDX for August 25, 2017
Posted On 25 Aug 2017
Comment: 0
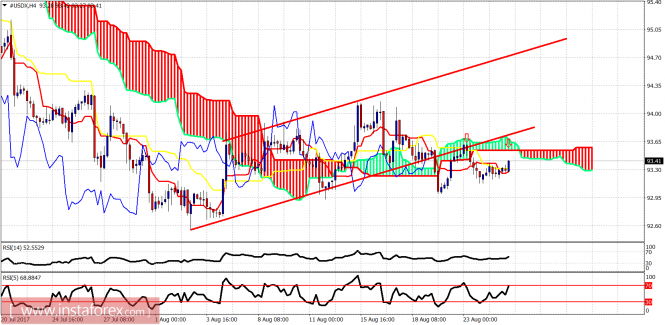
The Dollar index continues to trade sideways. Technically we have a breakdown of short-term support that should eventually bring price towards 91.60. Short-term trend is neutral. Medium-term trend is bearish.
Red lines -bullish channel (broken)
The Dollar index is heading towards the Kumo (cloud) resistance in the 4-hour chart at 93.60. If price breaks this resistance we should expect the lower channel boundary at 93.70-93.80 to be tested. At these resistance levels, short-term traders could try to open short positions as risk reward favors the bearish side.
Red lines – trading range
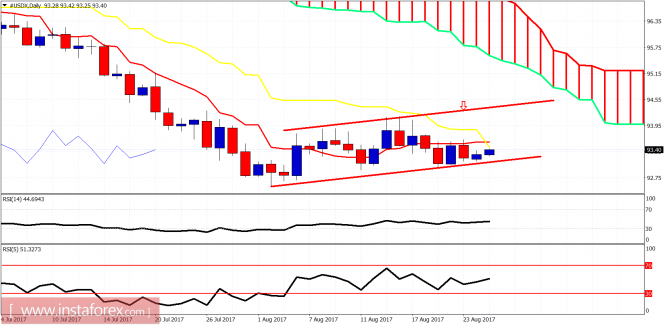
On a daily basis we see the kijun-sen (yellow line indicator) cross below the tenkan-sen (red line indicator). Although this would normally be a bullish sign, this is the result of the sideways movement of prices. Moreover, a cross below the cloud diminishes the strength of a bullish signal. I continue to expect that prices will break down towards 91.50. For this scenario to be confirmed we need to see new weekly lows.
The material has been provided by InstaForex Company – www.instaforex.com
Source:: Ichimoku indicator analysis of USDX for August 25, 2017


