
Previous Story
Ichimoku indicator analysis of USDX for May 10, 2017
Posted On 10 May 2017
Comment: 0
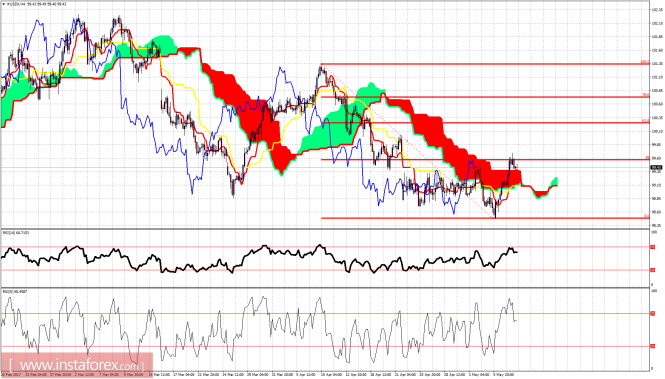
The US dollar index bounced yesterday, as expected, and reached our first target at 99.50 where the 38% Fibonacci retracement resistance is found. A clear daily break above 99.60 will open the way towards 100.20 as the price has broken above the 4 hour cloud resistance.
The USD index is above the 4 hour cloud resistance but has stopped the rise right at the 38% Fibonacci level. We could see a pullback towards the cloud support at 99 where the short-term support is found. The next important resistance lies at the 61.8% Fibonacci retracement. Only a break above it will increase the chances that a medium-term low is in.
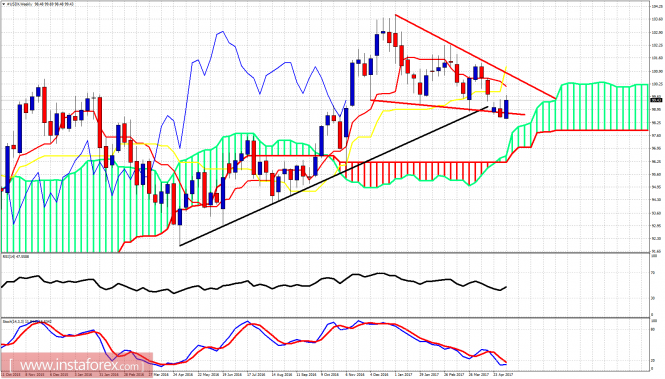
Red lines – triangle
Black line – long-term trend line support
USDX remains inside the triangle pattern and above the weekly Kumo. The price is bouncing as expected and could even reach the upper triangle boundary resistance at 100.30. Only a break above the 100.30 and 101.30 will confirm that an important low is forming and that a new up trend has started.
The material has been provided by InstaForex Company – www.instaforex.com
Source:: Ichimoku indicator analysis of USDX for May 10, 2017


