
Previous Story
Improving Position Sizing with Machine Learning

Machine learning is a powerful tool for not only coming up with new strategies but also for improving your existing strategies.
In this article, we’ll cover improving position sizing using a random forest algorithm and when to turn off your strategy on an off using a Hidden Markov Model. You can download the R code here and the same set of historical trades here to recreate the following results.
How to Improve Position Sizing
Position sizing is an important, often overlooked aspect of trading. Many traders look at position sizing as a way to decrease downside risk without seeing it as a tool to increase performance. While it is important not to risk too much of your total account on each trade (usually around 2%), there are far better ways than just using a fixed lot, or fixed percentage, position size for each trade.
One logical train of thought would be to enter a larger position when your trade has a higher probability of success and a smaller position when you are less sure about the trade. Using a random forest, a popular machine-learning algorithm, we can estimate the probability of success for each trade and size accordingly (never risking more than 2% per trade of course).
I went into greater detail on using a random forest to build a Bollinger Band-based strategy for the GBP/USD and we can use a similar approach to help us determine the optimal position size.
Given my data set of historical trades, first we classify each trade into three categories based on its return:
- Winning Trades
- Returns >= 10 pips
- Ideally we want to enter into larger positions for these trades
- Neutral Trades
- Returns < 10 pips and Returns >= -10 pips
- We can use this as our default position size
- Losing Trades
- Returns < -10 pips
- We want to enter into smaller positions for these trades
Next we have to decide what information we want to use to make our decision, otherwise known as the inputs to the model. This is an area where you should use your experience with your own strategy to make a decision. A couple different options:
- Current Market Conditions
- Inputs: Volatility, trending or sideways market, etc.
- This is appropriate if your strategy tends to perform well in certain market conditions
- Recent Performance
- Inputs: the returns of the last “n” trades
- If you notice your strategy goes through periods when it performs well and periods when it underperforms, this is probably the way you want to go.
- External Factors
- Inputs: major news announcements, holidays, Mondays/Fridays, etc.
- While some traders will avoid trading around these “external factors”, testing to see if this is justified is usually a good idea.
Let’s try using the returns of the last 3 trades to determine the position size of our next trade. We will double our position size if the model predicts the next trade will be a “Winning trade” (defined as a return over 10 pips) and cut it in half if it predicts a “Losing trade” (a return of less than -10 pips) and keep the default position size for all “Neutral trades” (returns less than 10 pips but greater than -10 pips). We train the model on the first two thirds of the data set (our historical trades) and then test it on the final third of the trades, our out-of-sample test:
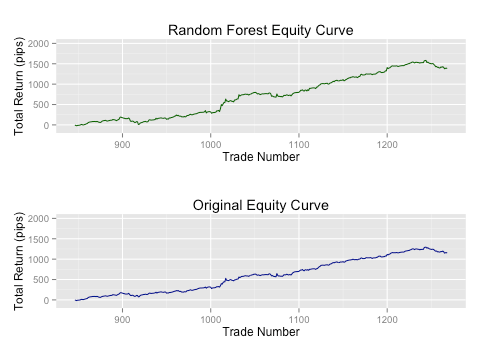
Wow! We were able to get a 20% increase in total return and increase our return per trade from 2.8 pips to over 3.3 pips just by using this fairly basic model. Not bad at all!
Turning Your Strategy Off/On
Knowing when to start and stop trading can mean the difference between success and failure. However, determining when to “turn off” your strategy is a non-trivial task. Once again we can use a popular machine-learning algorithm, known as a Hidden Markov Model (HMM), to determine market regimes where our strategy underperforms and we should stop trading. (We used a similar technique in a previous post using an HMM to identify market conditions).
First we have to decide what we want to use to identify the different “regimes” of our strategy’s performance. We are asking ourselves “what factors will tell us that we should stop trading our strategy?”
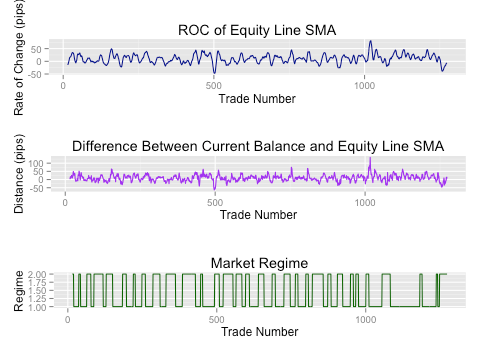
Let’s try using two calculations based off of a 10-period simple moving average (SMA) of our equity curve. We are going to look at both the rate of change over 5-periods and the distance between the current balance of the equity curve and the SMA line. The rate of change (ROC) should tell us if our equity curve is in a general downtrend and the distance between the lines should give us a much more sensitive measure of how the strategy is performing.
Now, based on these two inputs, we will us a 2-state HMM model to decide when we should “turn off” our strategy:
We will then look at the performance of the strategy if we stop trading whenever the HMM model classifies the strategy in “Regime 2” (be sure that you shift the HMM’s classification back one data point so you are only using data that would actually be available):
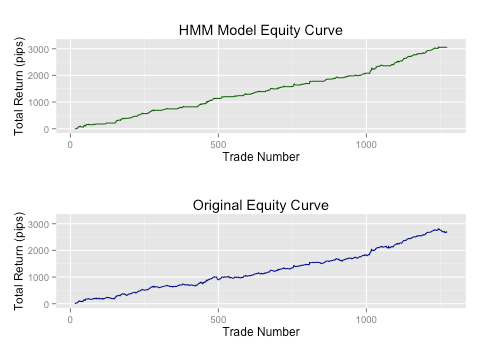
Once again, we see a significant increase in performance! We were able to see a 13% increase in return despite decreasing our number of trades from 1259 to 726, almost doubling our return per trade from 2.1 pips to 4.2 pips, and increase our accuracy from 60% to 67%!
Combining Our Models
Finally, let’s see what happens when we combine our random forest position sizing model with the HMM regime shifting model on our out-of-sample data set:
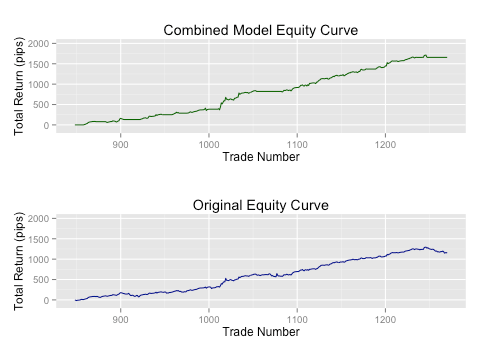
By both adjusting our position size based on a random forest model and halting trading when conditions were unfavorable we were able to significantly increase the performance of our strategy. The final return was 44% higher despite having 133 less trades, leading to our return per trading jumping from 2.7 pips to 5.7 pips and the accuracy increasing from 64% to 70%.
Machine learning algorithms and techniques can be a powerful weapon in your arsenal when looking to improve the performance of your strategy.


Hi,
Is this a recursive model? In the CSV sheet, we already have trades but I would like to predict these trades and modify position sizing accordingly. Could you guide on this.
Regards
BNS
Hi BNS,
This post was compiled by Inovance and they unfortunately don’t have access to your questions posted here. May we recommend you visit their site at https://inovancetech.com/