
Previous Story
Monday 10th November: Weekly technical outlook and review.
Posted On 10 Nov 2014
Comment: 0
EUR/USD:
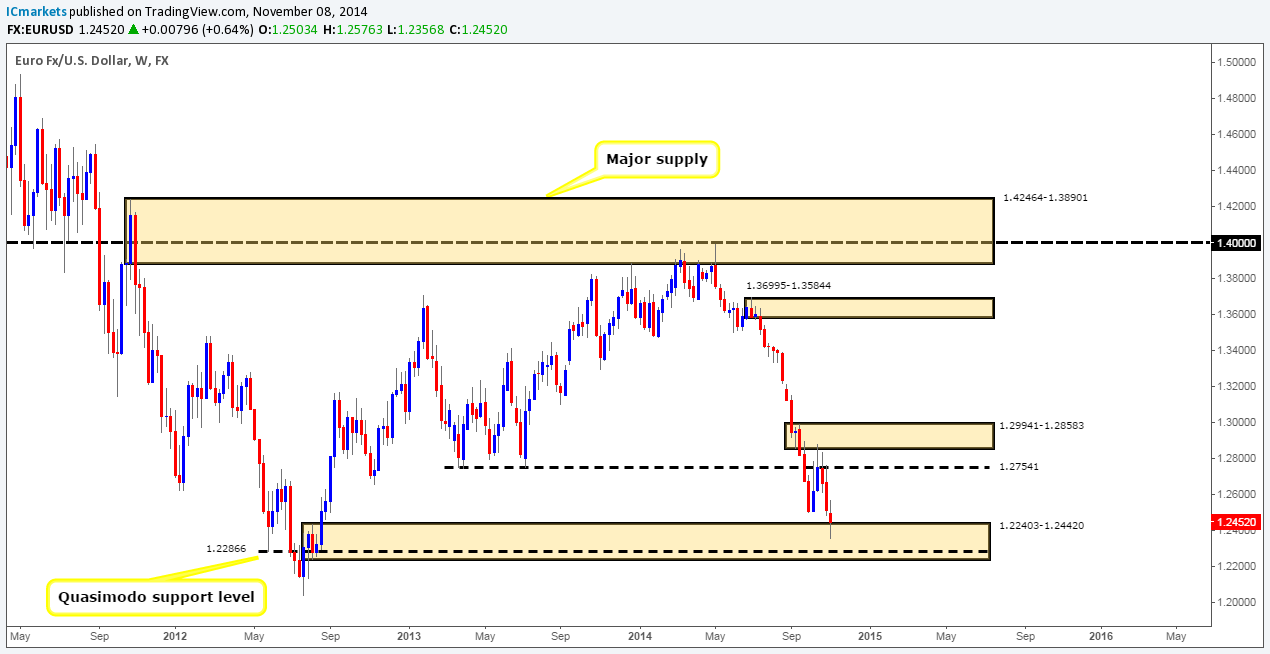
Weekly Timeframe: The weekly timeframe shows that after two weeks of consecutive selling, buying interest may be coming into the market, as a weekly indecision candle formed last week around a combined weekly demand/Quasimodo support area seen at 1.22403-1.24420/1.22866. Assuming that further buying is indeed seen here, price could possibly trade all the way back up to 1.27541, a weekly support flip level. On the other hand, follow-through selling would effectively force prices deeper into this weekly demand area, potentially hitting the weekly Quasimodo support level at 1.22866.
Daily Timeframe: At the time of writing, the EUR/USD is trapped between a small daily supply area at 1.25763-1.24794, and a long-term daily demand area seen at 1.22877-1.23809. It is only once one of these areas is consumed, will we then have more of an idea on future direction. Let’s take a look on the 4hr timeframe to see what we can find.
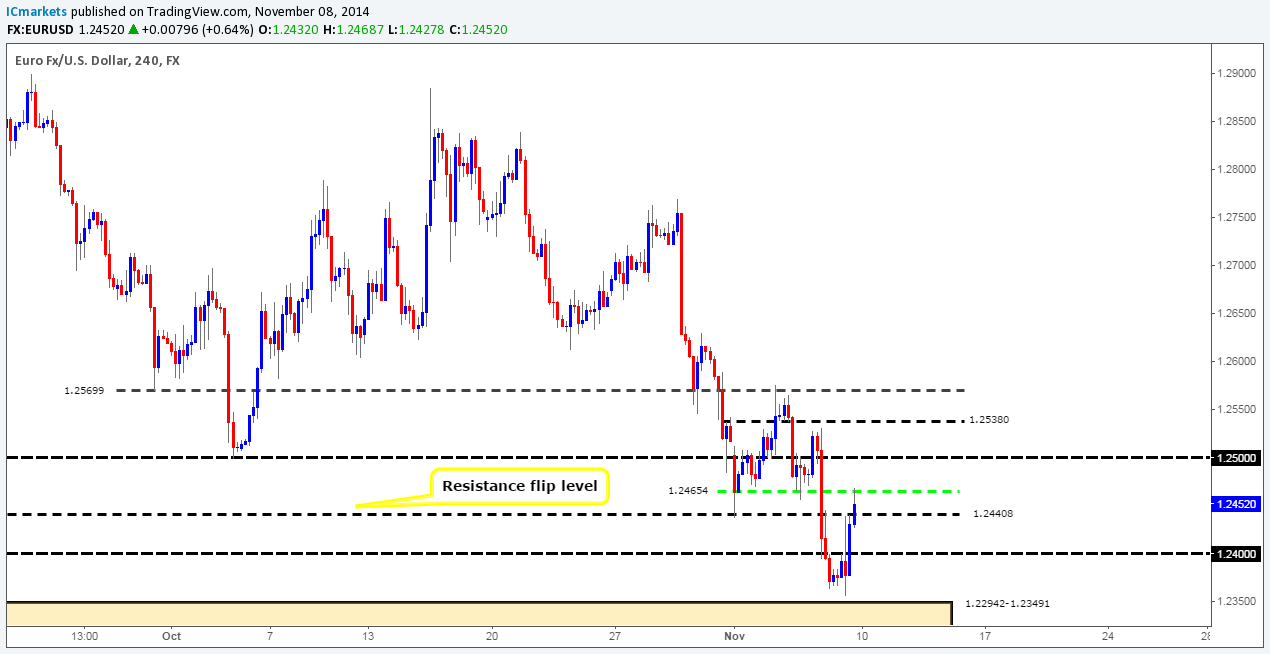
4hr Timeframe: The 4hr timeframe shows that price just missed the 4hr demand area at 1.22942-1.23491 (located within both the weekly demand area at 1.22403-1.24420, and the daily demand area seen at 1.22877-1.23809) before taking off north. This move was likely fuelled by the negative NFP numbers released on Friday.
With all the above taken into consideration, where can we see prices trading to this week?
Just before the market closed for the week at 1.24520, a close above a 4hr resistance flip level coming in 1.24408 was seen, which for the time being seems to have respected a minor support flip level just above as resistance (marked in green) at 1.24654. In our opinion one of two things can happen here:
- The selling pressure from 1.24654 could force price to retest the 1.24408 level, which in turn may encourage further buying of the Euro. As a consequence this will likely push prices further into the aforementioned daily supply area towards 1.25 (tentative sell orders are seen just below at 1.24973).
- The selling pressure from 1.24654 may be too strong for the buyers to withstand around 1.24408, and as a result a break of this level could be seen. This will very likely clear the path for further selling down to at least 1.24 where active buyers may be lurking at 1.24057.
Both the round-number levels mentioned above are valid trading areas (1.25/1.24). However, placing limit orders blindly at these levels puts you at risk of unnecessary losses. Waiting for lower-timeframe confirmation may be the best path to take in this case.
Buy/sell levels:
- Buy orders: 1.24057 [Tentative] (Predicative stop-loss orders seen at: 1.23749).
- Sell orders: 1.24973 [Tentative] (Predicative stop-loss orders seen at: 1.25171).
GBP/USD:
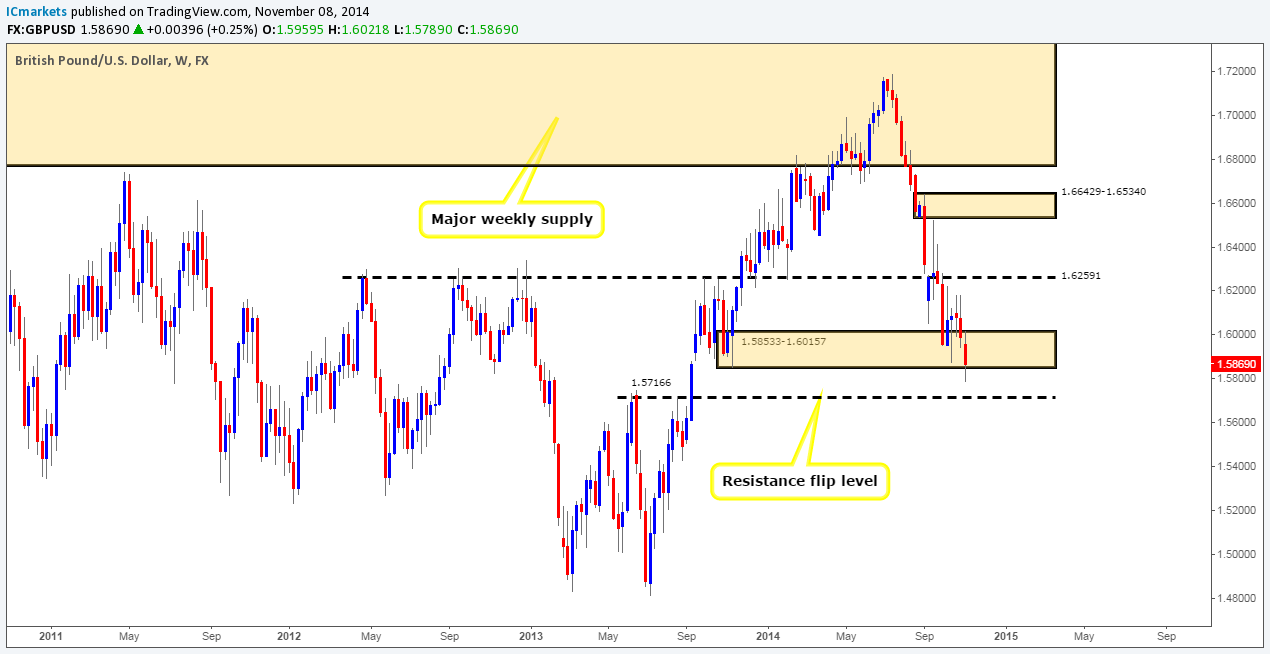
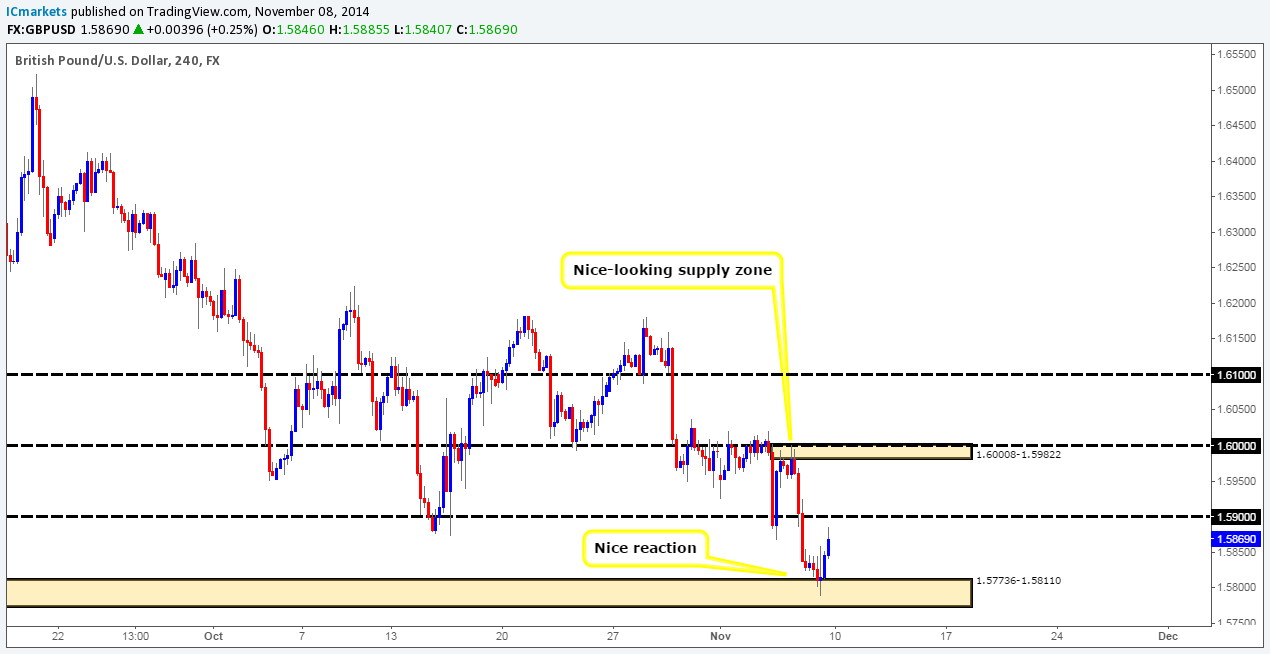
Weekly Timeframe: Last week saw the British pound take a tumble resulting in the weekly demand area seen at 1.58533-1.60157 being broken. This move potentially opens the gates for price to challenge 1.57166, a strong-looking weekly resistance flip level. That being said, we have to take into consideration the fact that price did not actually close below this area, this may in itself indicate a fakeout may have taken place to gather liquidity for higher prices. Let’s take a look on the lower timeframes to see what we can find.
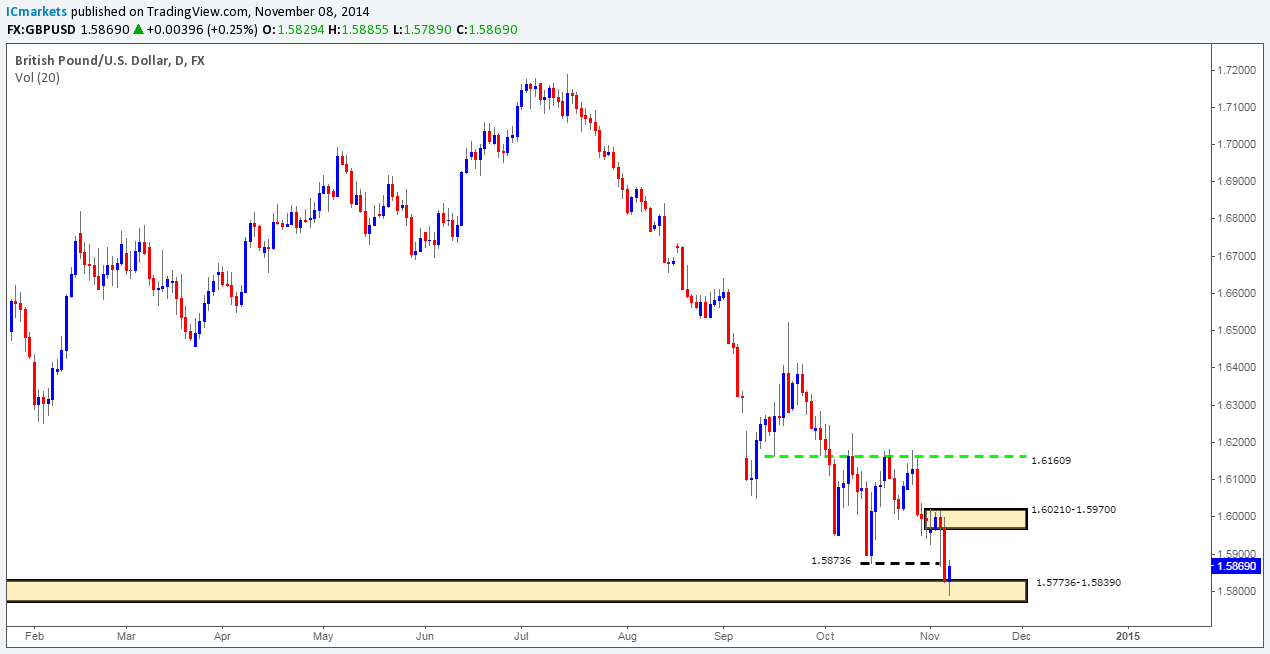
Daily Timeframe: The daily timeframe shows that price reacted off of a fresh daily rally-base-rally demand area at 1.57736-1.58390, indicating that the small break of the weekly demand area (see above) may well have been a fakeout. We feel there is a good chance that higher prices will likely be seen from here this week. Are we not concerned about the small daily support flip level at 1.58736? Normally we would be. However, in this case we’re not. Here’s why, check out the tail seen at 1.58674, this consumed all the buy orders to allow prices to drop in the first place, and as a result minimal transactions likely took place around this minor swap level, meaning there are very likely not many unfilled sell orders here to repel the market. The unfilled sell orders will likely be lurking above, around the 1.60210-1.59700 area (daily supply). This is where we believe the selling begun – the origin of the move and this is where we feel prices will trade to sometime this week.
4hr Timeframe: The 4hr timeframe shows that price reacted beautifully off of a 4hr demand area at 1.57736-1.58110 (located deep within the aforementioned daily rally-base-rally demand area). What it also shows is that before price can reach the aforementioned daily supply area, we have to be prepared for some selling opposition to be seen around 1.59 (tentative sell orders are seen just below at 1.58972). In the event that price breaks above 1.59, which we believe it will, we can likely assume higher prices will be seen up to at least a small 4hr supply area at 1.60008-1.59822 (located deep within the aforementioned daily supply area). This could present a fantastic opportunity to play the retest, targeting the 4hr supply area just mentioned above.
Buy/sell levels:
- Buy orders: N/A (Predicative stop-loss orders seen at: N/A).
- Sell orders: 1.58972 [Tentative] (Predicative stop-loss orders seen at: 1.59321).
AUD/USD:
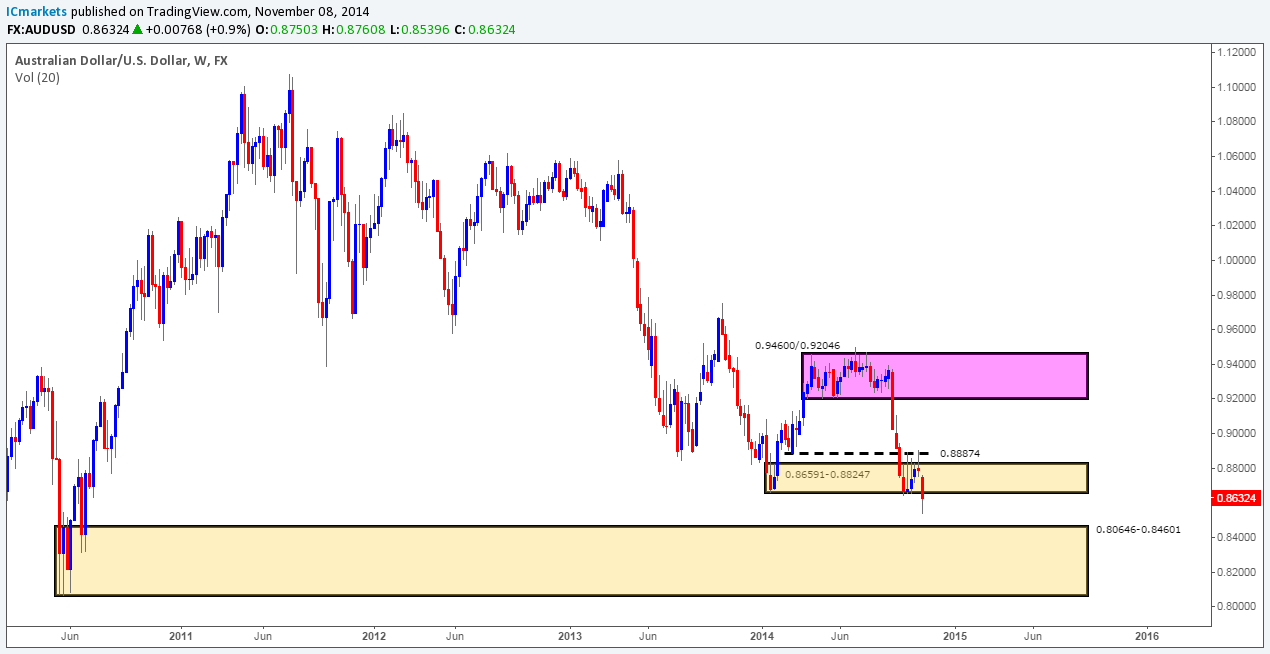
Weekly Timeframe: The weekly timeframe shows that price has aggressively broken below a weekly demand area coming in at 0.86591-0.88247, forcing the market to close the week at 0.86324. Assuming that further selling is seen from here, we can likely expect price to test the huge weekly demand area looming below at 0.80646-0.84601 either this week or the next. Let’s take a look to see what the lower-timeframe picture is like.
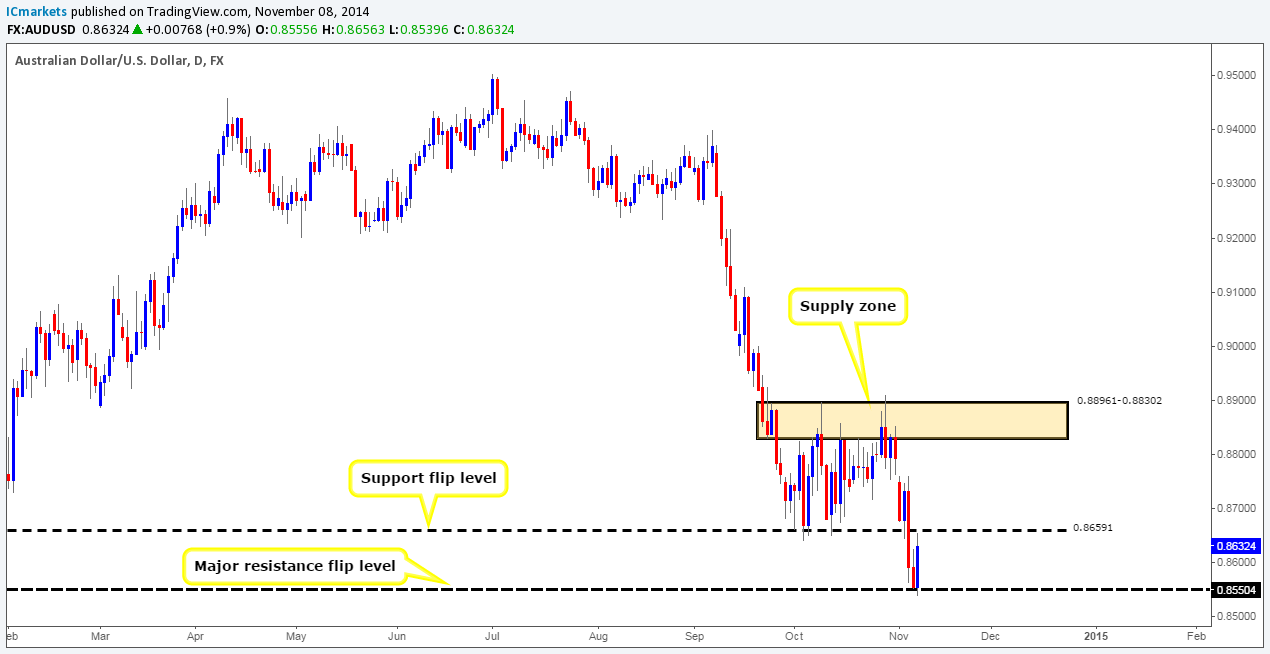
Daily Timeframe: Price reacted beautifully off of a major resistance flip level seen at 0.85504, which was very likely fueled by the negative NFP numbers released on Friday. Aussie Dollar buying continued right up to a daily support flip level coming in at 0.86591, which is where a little selling interest was seen coming into the market. Price is now effectively trapped between these two levels at the moment. A break above could potentially see price trading up to at least the daily supply zone at 0.88961-0.88302, and conversely, a break below would likely force prices to test a daily demand area seen at 0.83147-0.84336 (located within the weekly demand area mentioned above at 0.80646-0.84601).
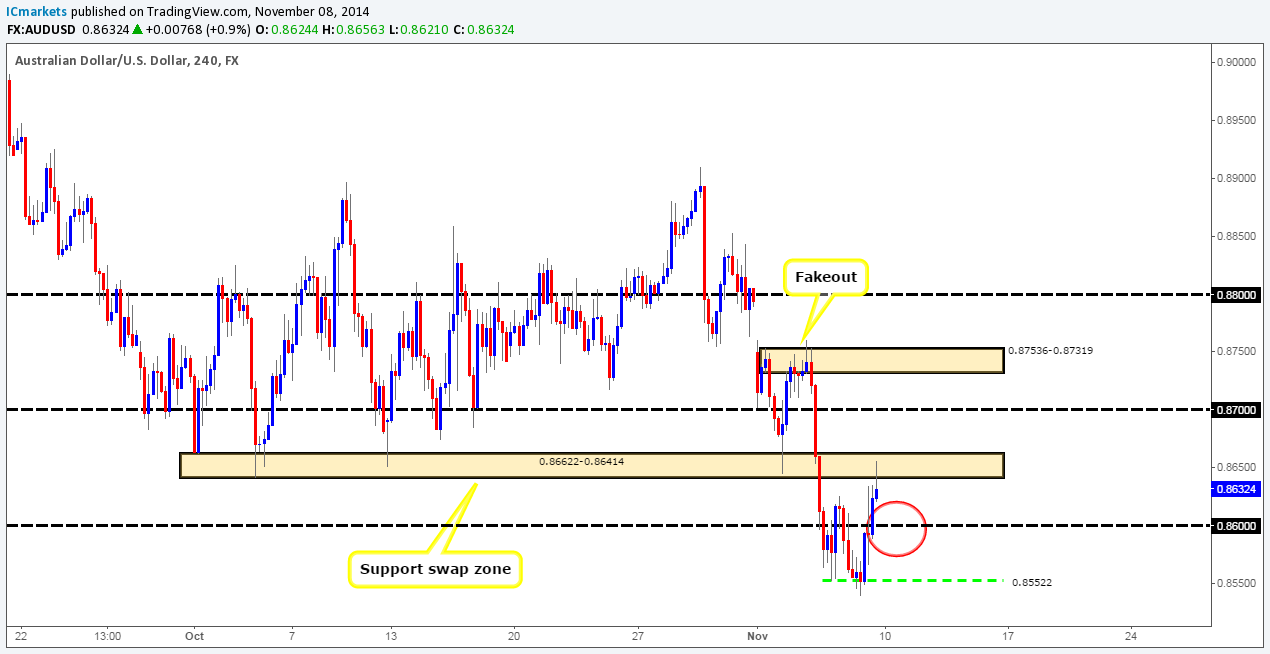
4hr Timeframe: For anyone who follows our analysis regularly, you may recall us mentioning on Friday that a potential buying opportunity may present itself if the low 0.85522 is faked out, and as we can all see this did in fact happen. We do hope some of our readers locked in some pips from this move! The market closed on Friday (0.86324) with active selling being seen around a support swap zone at 0.86622-0.86414, which as a result formed a 4hr bearish pin-bar candle. This may likely get a lot of pin-bar enthusiasts excited, prompting them to enter short on the break of the low. This could be a perfect entry south, as let’s not forget that the weekly timeframe is indicating that there is plenty of room to the downside. However, risk/reward considerations for us argue against entering short with prices so close to a potential support level at 0.86.
With all of the above taken into consideration, we feel that there is a good chance further selling will be seen down to at least the 0.86 level (tentative buy orders are seen just above at 0.86052). It is here though that an important decision will need to be made, we have drawn a red circle here to represent this as such. Assuming the bulls come into the market around this important level, price could effectively rally up to around 0.87, since most of the selling opposition has likely been consumed already by the aforementioned pin-bar candle. Conversely, a break below this level would likely attract further selling down to a 4hr Quasimodo support level seen at 0.85522 (Just a little above the aforementioned daily resistance flip level), where we would expect active buyers to be waiting around 0.85568.
We would advise anyone who is considering entering long around the two levels mentioned above to wait for some sort of lower-timeframe confirmation, rather than just entering blindly with a pending order.
Buy/sell levels:
- Buy orders: 0.85568 (Predicative stop-loss orders seen at: 0.85352) 0.86052 [Tentative] (Predicative stop-loss orders seen at: 0.85853).
- Sell orders: N/A (Predicative stop-loss orders seen at: N/A).
USD/JPY:
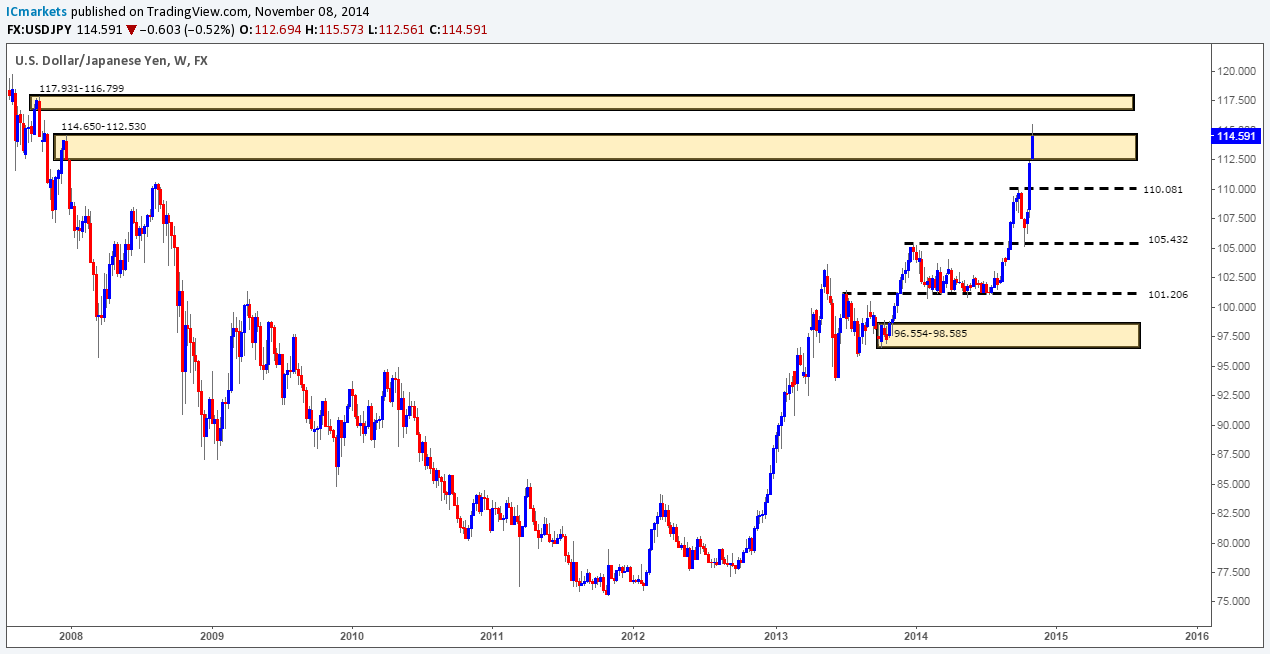
Weekly Timeframe: The buyers were once again on fire last week pushing prices above the weekly supply area coming in at 114.650-112.530. Nonetheless, price was unable to positively close above this area, since the market closed just within at 114.591. The wick seen above was big considering the timeframe we’re on (115.573), and has likely stopped out a ton of traders who attempted to fade the weekly supply area in the process. This move has potentially cleared the path north for prices to move up to at least another weekly supply area seen at 117.931-116.799, but at the same time gave pro money a load of buy stops to sell into, so further selling could indeed be seen! Let’s see what the lower timeframes have to say about this.
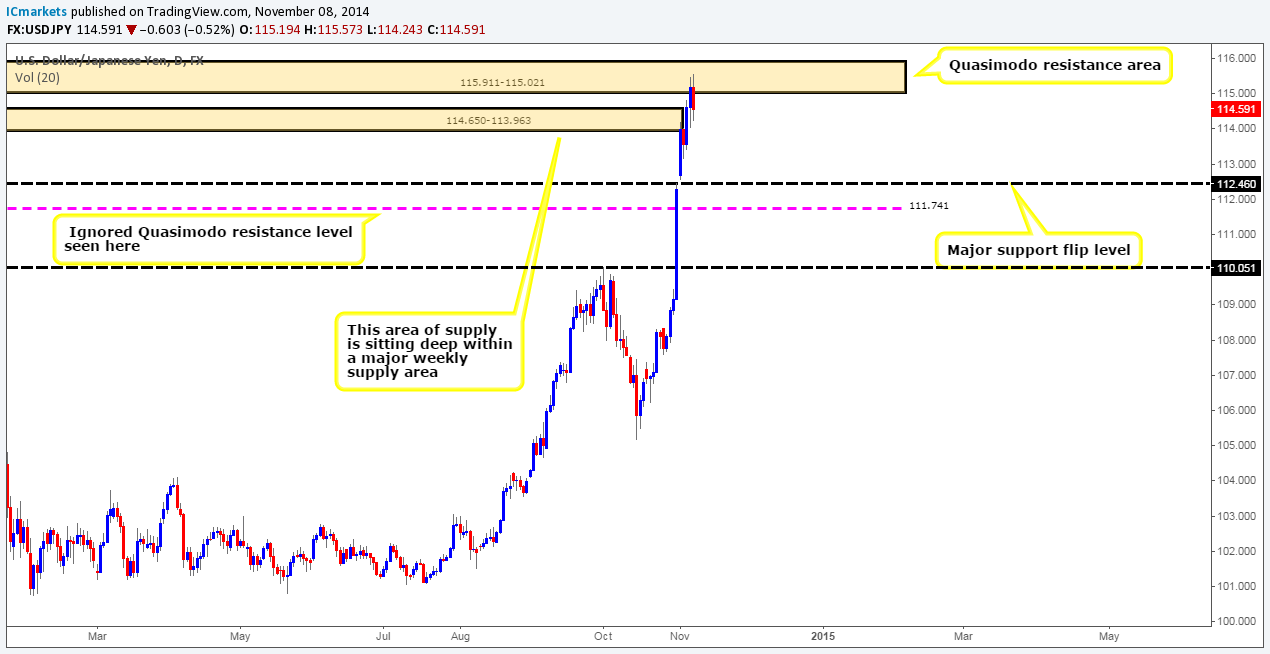
Daily Timeframe: The daily timeframe shows that active selling was seen on Friday around a daily Quasimodo resistance area at 115.911-115.021. This – like most of the major pairs was likely fueled by the negative NFP numbers announced on Friday. In our opinion, a daily close above this area would be required to negate a bearish bias.
4hr Timeframe: As already mentioned in the previous analysis, the historical data is not allowing us to see what the price action to the far left is like, so we’ll have to make do with what we currently have on the higher timeframes.
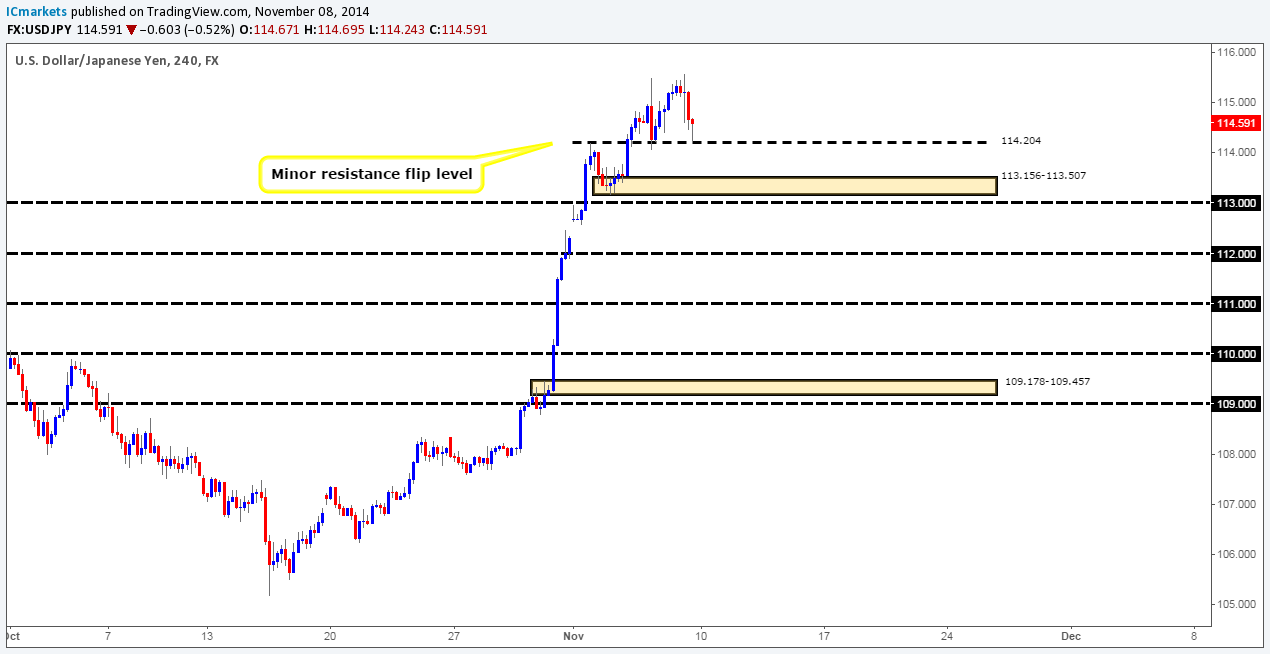
The negative NFP numbers forced prices lower down to 114.204, where once again a reaction was seen, only this time a bullish pin-bar candle formed.
In our opinion, the 4hr timeframe shows no bearish intention. If price were to close below 114.204, then that would be a different story altogether. As it stands now though, the buyers still seem to be in control of this market for the time being.
The only safe entry we see on this pair would be above the 4hr demand area at 113.156-113.507, going long at 113.604, but for price to reach here, the 114.204 level needs to be taken out first. So for now, we have decided to sit on our hands and see how price action unfolds.
Buy/sell levels:
- Buy orders: 113.604 (Predicative stop-loss orders seen at: 112.927).
- Sell orders: N/A (Predicative stop-loss orders seen at: N/A).
EUR/GBP:
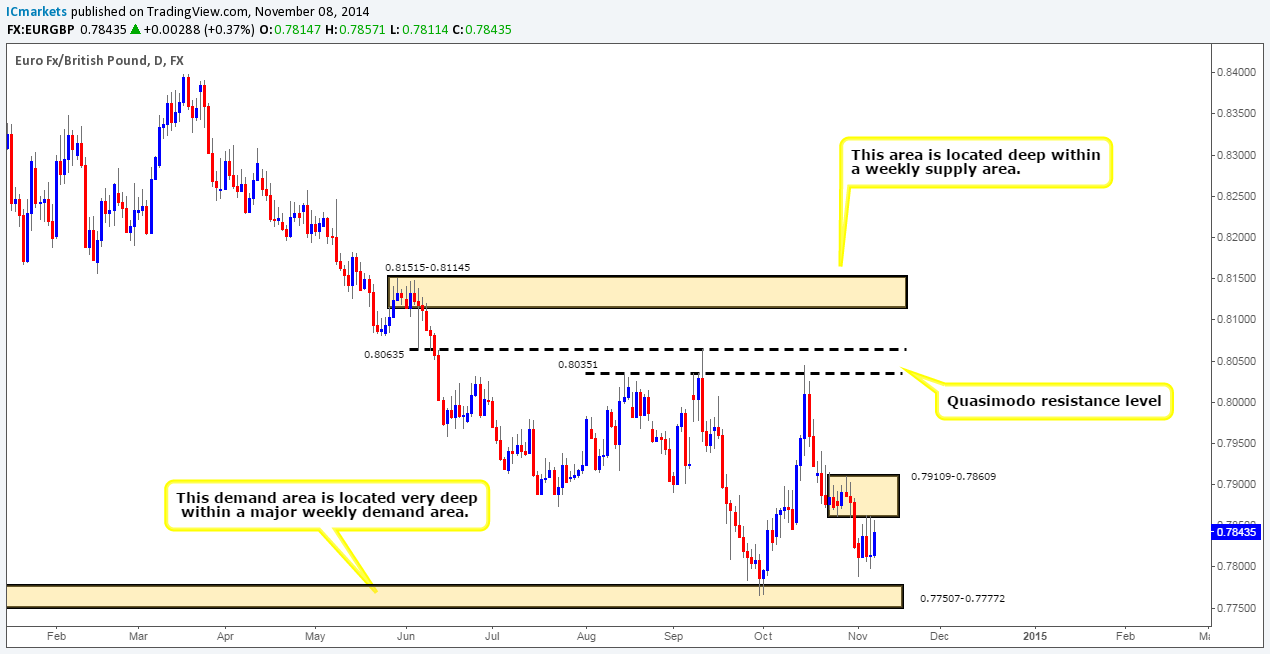
Weekly Timeframe: Price remains trading relatively deep within a weekly demand area seen at 0.76931-0.78623, where one would begin to normally look for entries long. Nevertheless, considering where price is currently located, we have not seen much in the way of buying strength over the past few weeks.
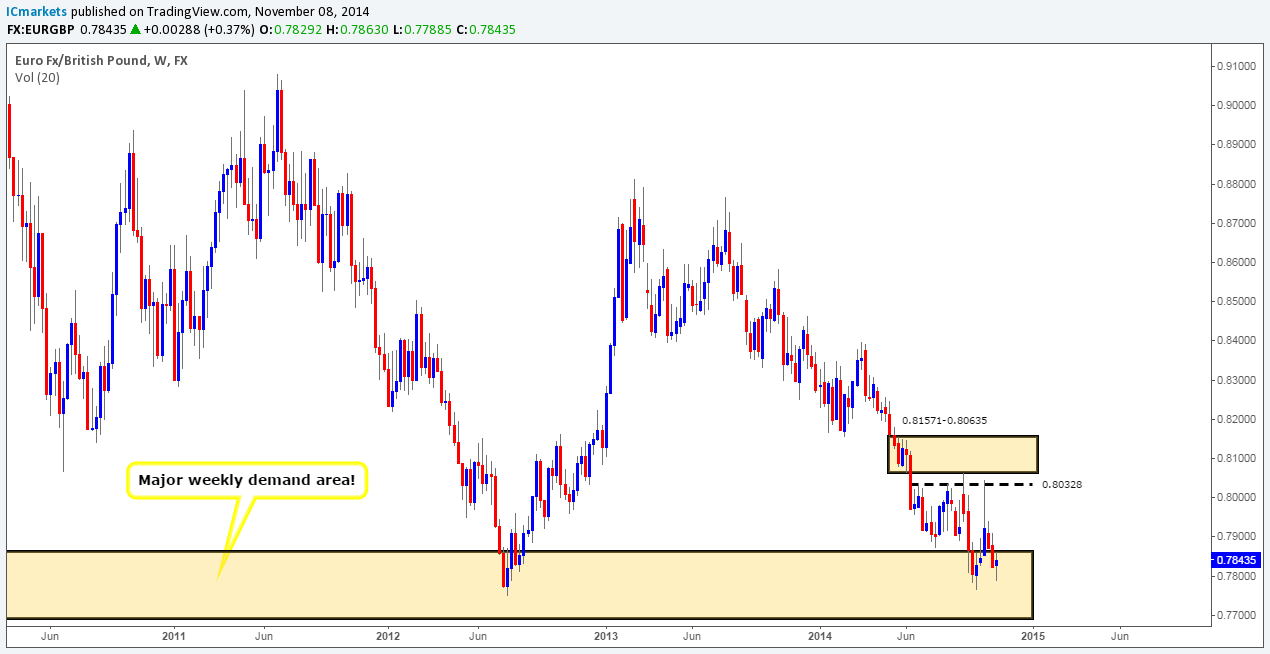
Daily Timeframe: Last week, all the way from Monday’s open, right through to Friday’s close, price was range bound between a minor daily supply area at 0.79109-0.78609 and 0.78132, a temporary daily support. There was certainly no direction given on this timeframe which made it a very difficult pair to trade last week.
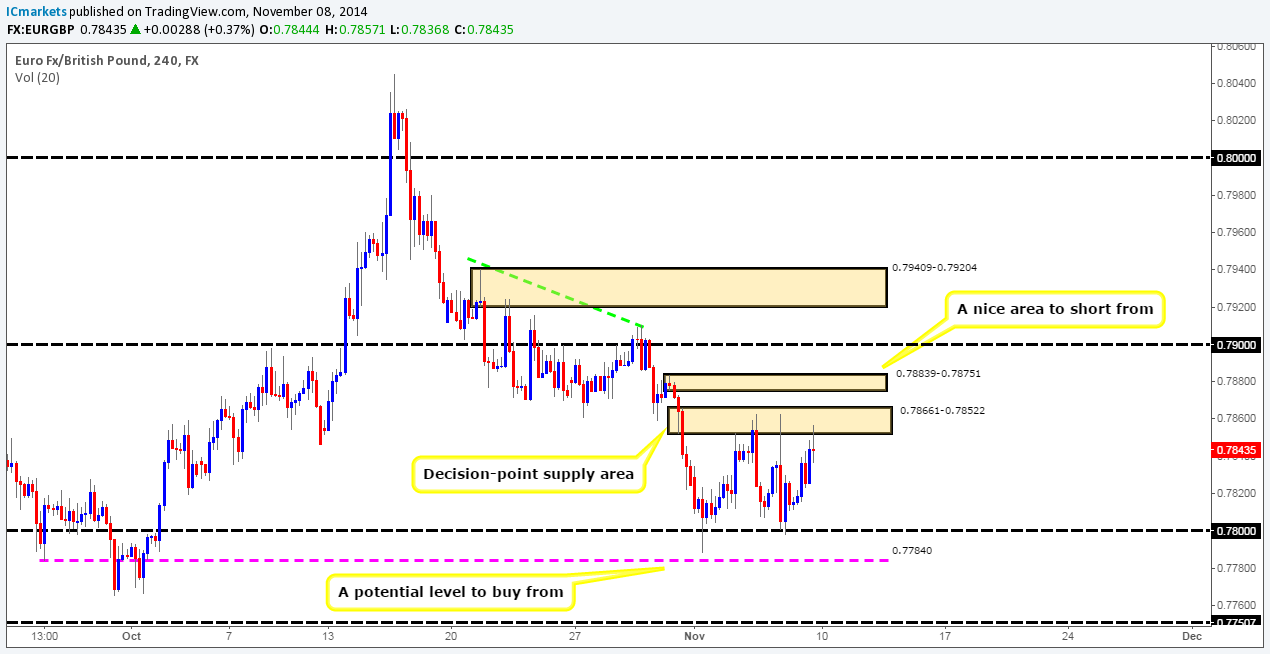
4hr Timeframe: The 4hr timeframe – like the daily timeframe has remained range bound for the entire week between a 4hr decision-point supply area at 0.78661-0.78522 (located just within the aforementioned daily supply area), and the round-number level 0.78. This is dreamy price action for range traders wishing to play the limits, with potential buys being seen at 0.78039, and sells at 0.78495.
However, for us personally, we would rather wait for this range to break, and to then trade off of the oncoming areas. In the event price breaks out north here, we will be looking to sell at 0.78736, just below a fresh 4hr supply area at 0.78839-0.78751. Likewise, assuming price breaks out south, we would be looking for buys around 0.77867, just above a 4hr Quasimodo support level at 0.77840. With the above all being taken into consideration, we currently favor a breakout north, as price is still located deep within a monster weekly demand area (levels above) at the moment, even if for the time being no bullish activity is being seen there.
Buy/sell levels:
- Buy orders: 0.77867 (Predicative stop-loss orders seen at: 0.77637) 0.78039 [Tentative] (Predicative stop-loss orders seen at: 0.77953).
- Sell orders: 0.78495 [Tentative] (Predicative stop-loss orders seen at: 0.78688) 0.78736 (Predicative stop-loss orders seen at: 0.78865).
USD/CAD:
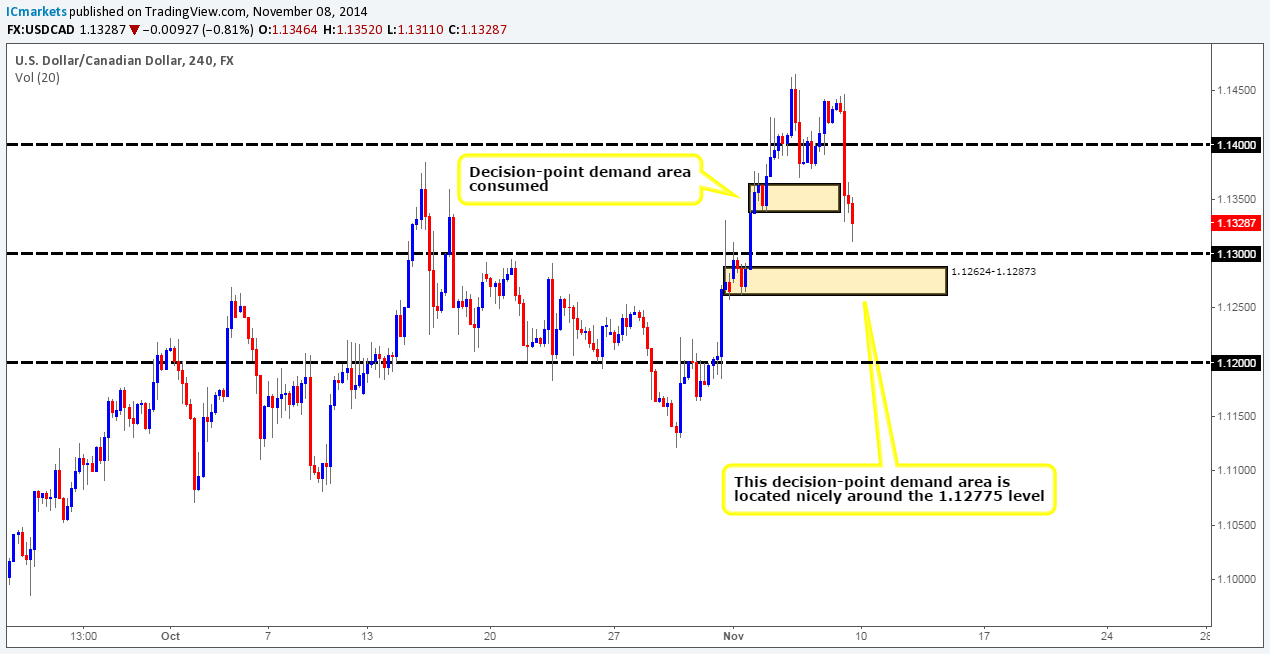
Weekly Timeframe: It was mentioned in the previous analysis that if price were to close above the medium-term weekly high at 1.12775, then this would likely confirm that higher prices may be seen up to a fresh weekly supply area coming in at 1.17225-1.15417. As we can all see, price did indeed close above this level, but look at the size of that selling wick that formed!!!!! It is massive. This indicates serious selling entered the market last week – not a great sign for anyone who is wishing to buy. Let’s take a look lower down to see what we can find.
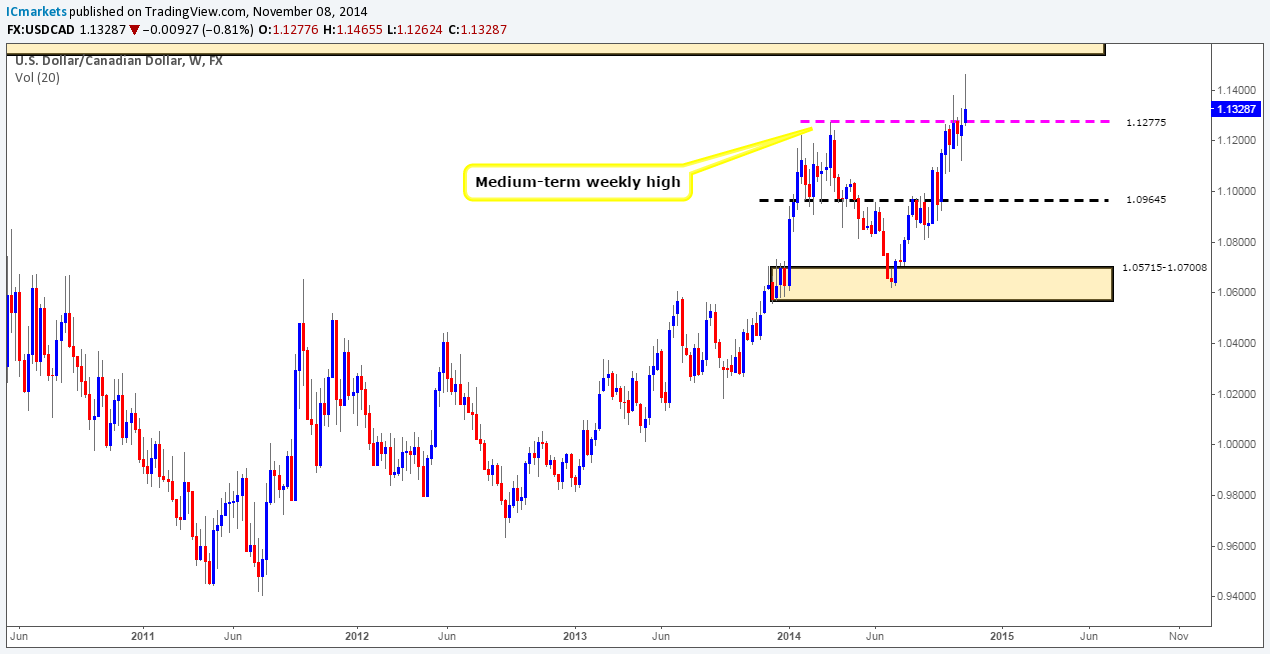
Daily Timeframe: The daily timeframe on the other hand appears relatively bullish to us, since a daily close below the 1.12775 barrier would be required to negate a bullish bias. This level would in fact be a nice area to look for longs if/once price reaches here. So all is not lost yet!
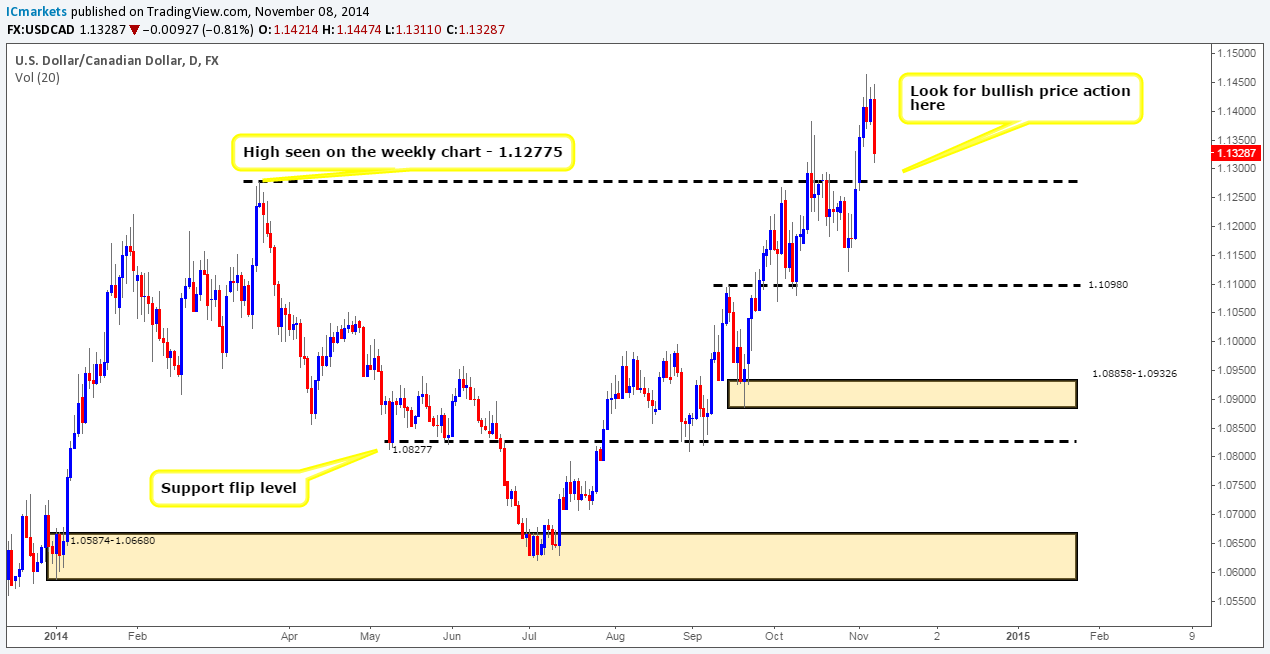
4hr Timeframe: The 4hr timeframe shows that the sellers have consumed the 4hr decision-point demand area at 1.13387-1.13635, clearing the path south down to 1.13. This is where things will likely get interesting. A lot of traders will be watching 1.13 and will be likely preparing to go long from this level, and why not, this level is very very close to the 1.12775 weekly level mentioned above. Nonetheless, some traders will likely miss the 4hr decision-point demand area lurking just below at 1.12624-1.12873 altogether. This area remains a very important one, as this is likely where pro money made the ‘decision’ to form a new higher high at 1.14655.
Taking all of the above into consideration, pro money will likely see the 1.13 level as a nice place to break, and collect all those lovely sell stops siting just below it, and at the same time triggering in any breakout sellers. This will give pro money the liquidity (sells for their buys) they need to buy into this market. So, we would prefer to buy around 1.12916, just above the 4hr decision-point demand area at 1.12624-1.12873 for the time being.
Buy/sell levels:
- Buy orders: 1.12916 (Predicative stop-loss orders seen at: 1.12534).
- Sell orders: N/A (Predicative stop-loss orders seen at: N/A)
USD/CHF:
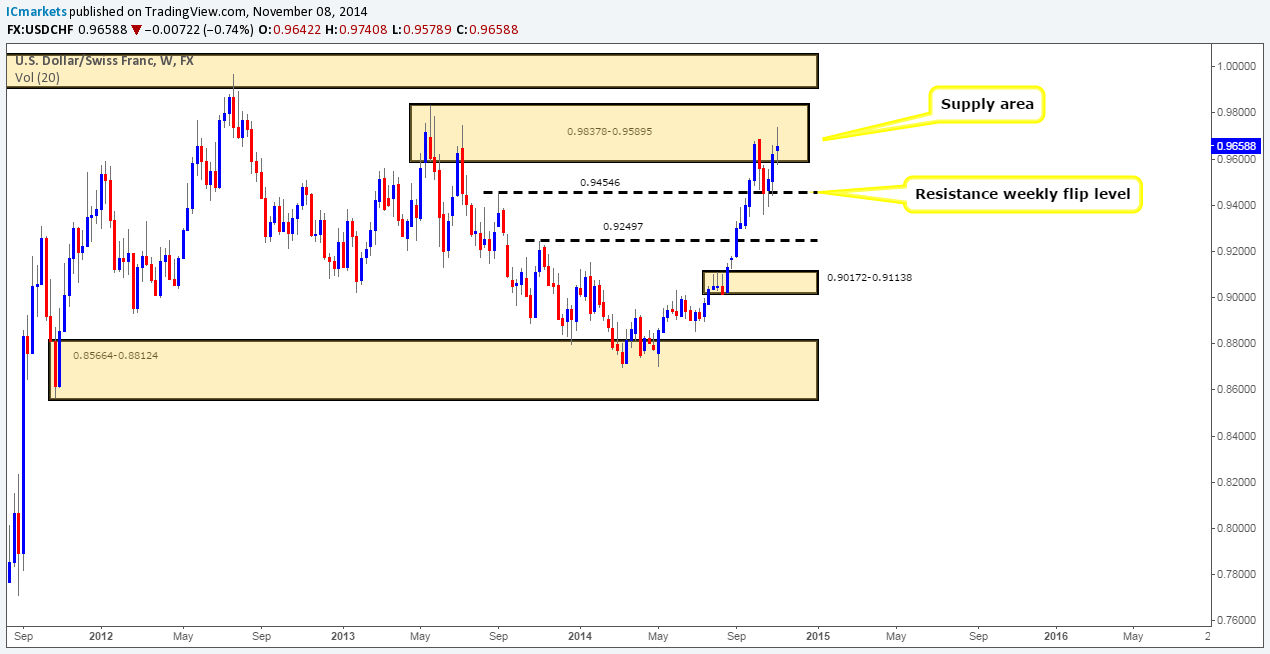
Weekly Timeframe: The weekly timeframe still shows price is capped between a weekly supply area coming in at 0.98378-0.95895, and a weekly resistance flip level seen at 0.94546. An indecision candle was formed last week within the aforementioned weekly supply area, which is no surprise since we saw the exact same thing on the EUR/USD, only within a weekly demand area. It will be interesting to see what the lower timeframes look like.
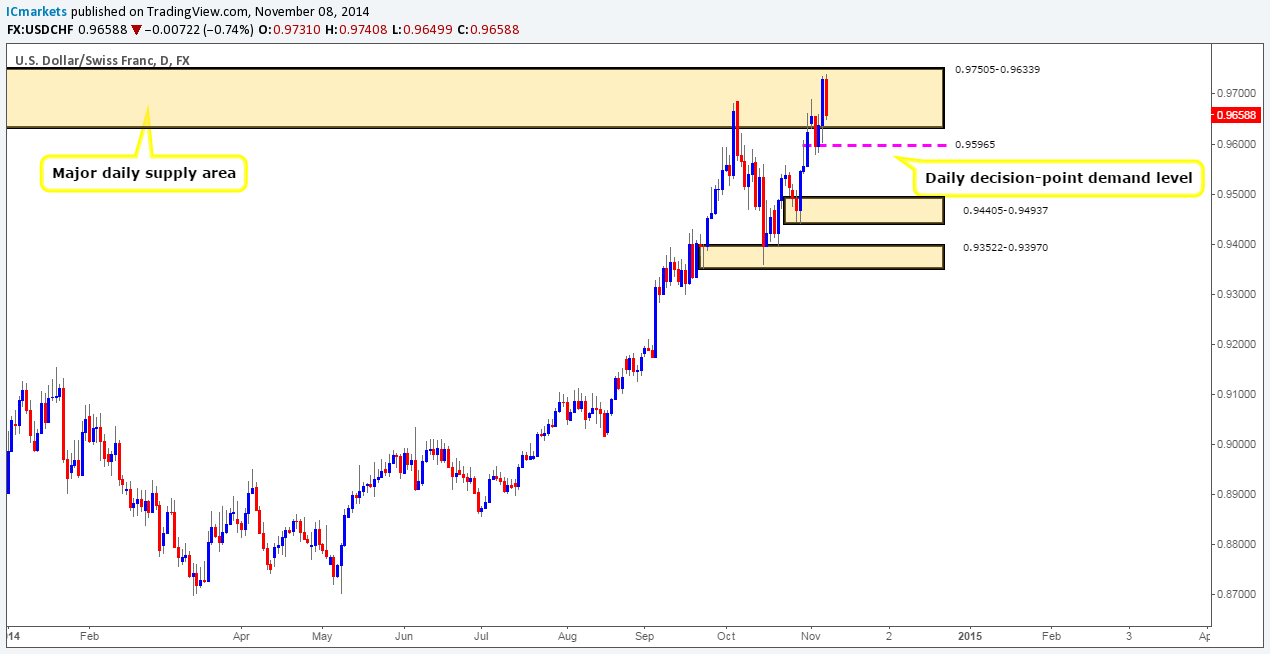
Daily Timeframe: Last week saw the buyers pushing price very deep within a major daily supply area seen at 0.97505-0.96339 (located within the aforementioned weekly supply area). Selling came into the market on Friday around 0.97408 which was likely because of the negative NFP numbers released that day. Assuming further selling is seen today, or even tomorrow, we feel there is a good chance that price could decline down to at least 0.95965, a small daily decision-point demand level. On the other hand, a break out above the aforementioned daily supply area would likely mean prices are going to challenge the extremes of the aforementioned weekly supply area.
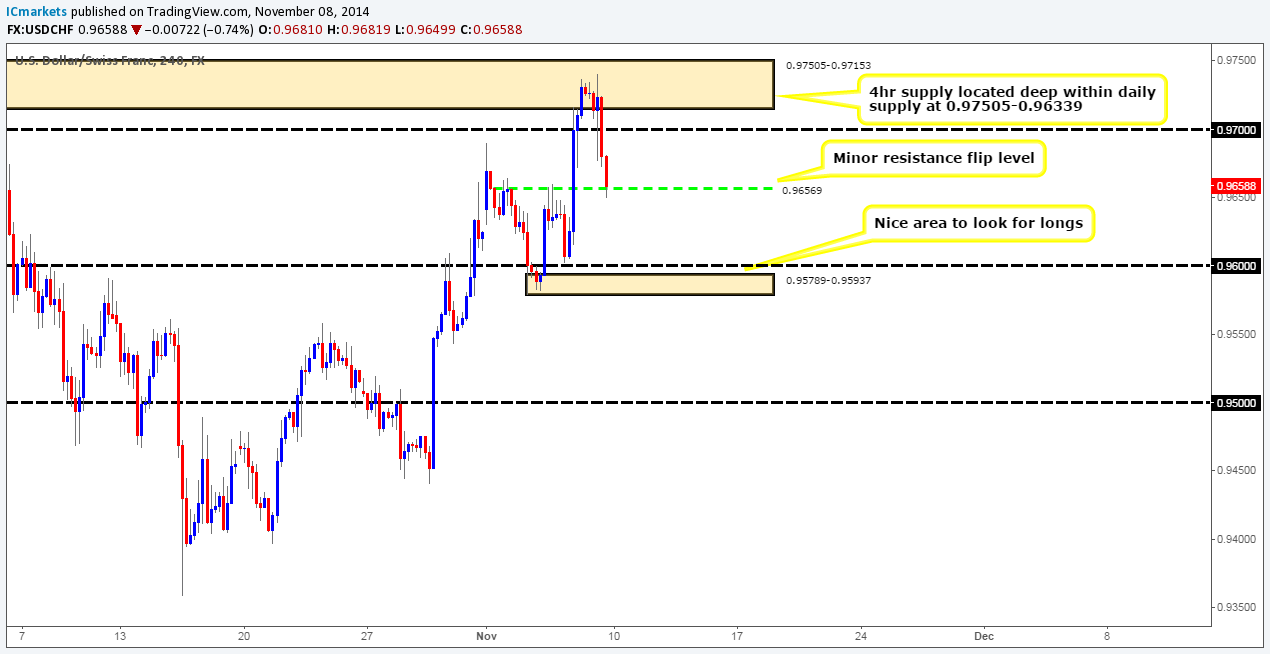
4hr Timeframe: The 4hr supply area seen at 0.97505-0.97153 (located deep within the aforementioned weekly and daily supply areas) turned out to be a fantastic place to go short. Price was sold heavily past the round-number level 0.97 into a 4hr minor resistance flip level coming in at 0.96569, which is where the market closed for the week at 0.96588.
We may see buying off of this level sometime today simply because a few traders may be liquidating some of their short positions from the 4hr supply area just mentioned – this will likely only cause a bounce mind you. Eventually though, we expect that price will likely push further south down towards 0.96. We would not be interest buying there; we would however be interested in buying just below at 0.95967, just above a small 4hr demand area at 0.95789-0.95937. Anyone who is also considering buying here may benefit from entering on lower-timeframe confirmation, since price could very well smash straight through this area since larger sellers could possibly come into the market from the weekly supply area mentioned above at 0.98378-0.95895.
Buy/sell levels:
- Buy orders: 0.95967 [Tentative] (Predicative stop-loss orders seen at: 0.95755).
- Sell orders: N/A (Predicative stop-loss orders seen at: N/A).
XAU/USD (GOLD):
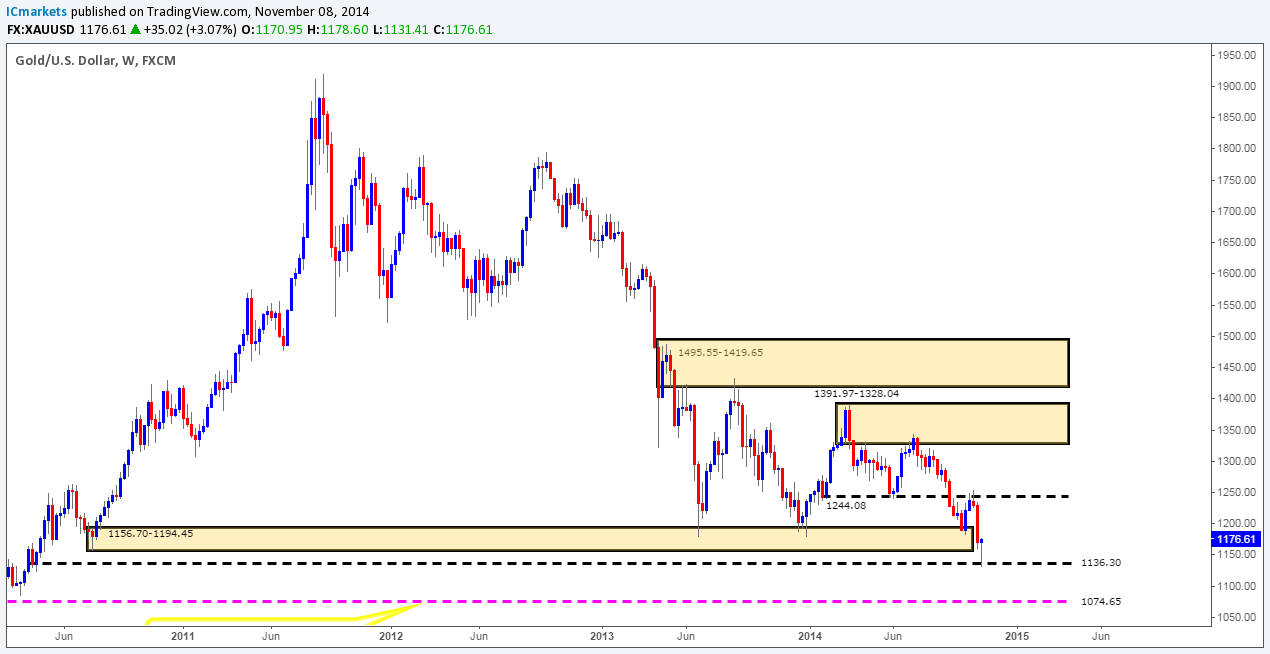
Weekly Timeframe: The weekly timeframe shows that price has beautifully faked below a weekly demand area at 1156.70-1194.45 into a small weekly decision-point demand level coming in at 1136.30. As a consequence this has formed a fantastic-looking bullish pin-bar candle. Should we all being buying now expecting prices to trade directly to 1244.08? Let’s take a look on the lower timeframes to see what’s on the horizon.
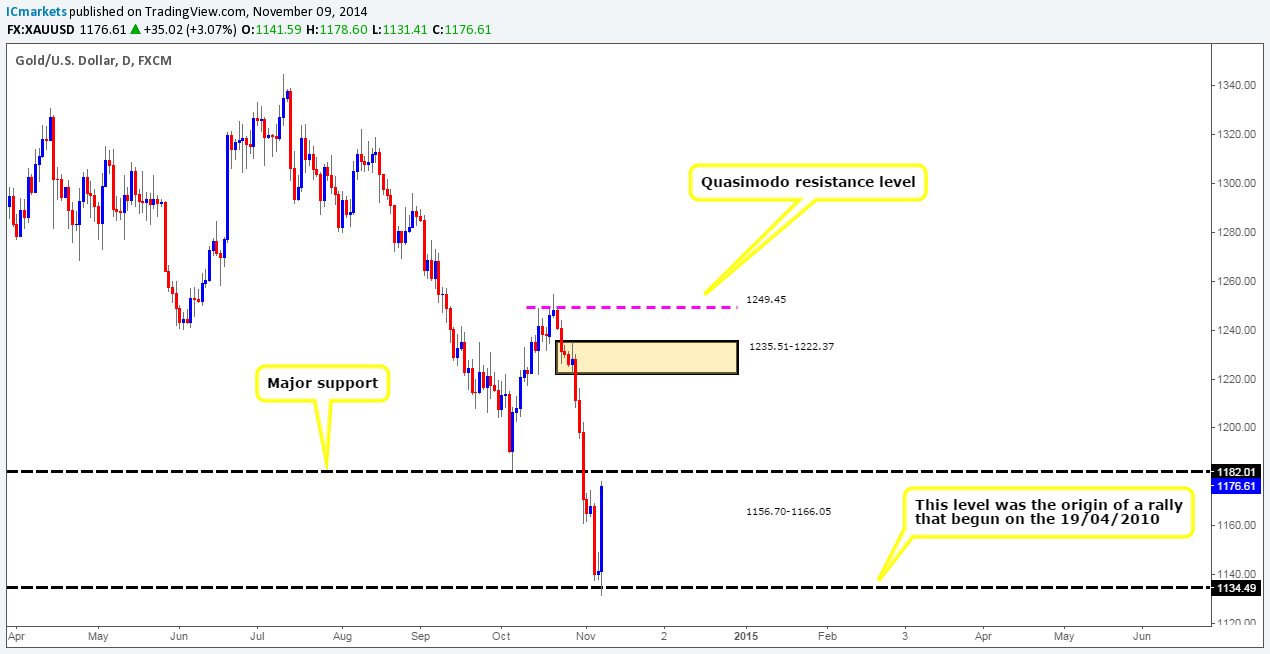
Daily Timeframe: We agree, the pin bar candle that formed on the weekly timeframe does indeed look yummy. However, if we take a look at the daily timeframe, it is clear that all price has effectively done is traded directly towards a major support flip level seen at 1182.01. Would you want to buy into that??!! A break above this level is what we’d like to see, this would be our signal to look for buying opportunities on the retest targeting the daily supply area above at 1235.51-1222.37.
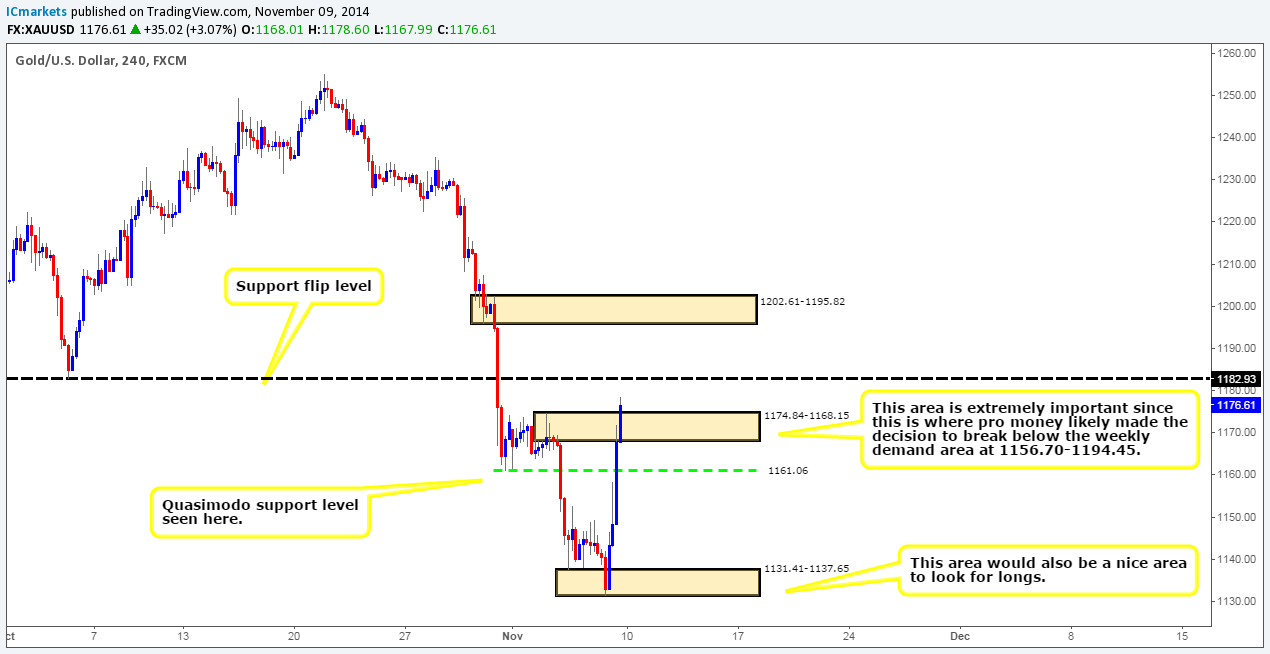
4hr Timeframe: In our opinion, the 4hr timeframe is showing some direction already, as price has consumed a very important 4hr supply area at 1174.84-1168.15. The importance comes from this being the area where pro money likely made the decision to break below the weekly demand area mentioned above at 1156.70-1194.45.
With that being said, we would only consider entering long with lower-timeframe confirmation around 1162.23, just above a 4hr Quasimodo support level at 1161.06. This is also subject to a reversal being seen almost immediately when the market opens today, WITHOUT hitting the 4hr support flip level above at 1182.93, as this would make a very healthy take-profit target. The reason for needing lower-timeframe confirmation is simply because if the market does the above, then price would effectively still be trading below the major daily support flip level mentioned above at 1182.01, so in essence we would be taking this trade long with no daily timeframe direction, and relying solely on the pin-bar reaction seen off of the weekly demand area at 1156.70-1194.45.
Buy/sell levels:
- Buy orders: 1162.23 [Tentative] (Predicative stop-loss orders seen at: 1157.08).
- Sell orders: N/A (Predicative stop-loss orders seen at: N/A).
Source:: Monday 10th November: Weekly technical outlook and review.


