
Previous Story
Monday 1st December: Weekly technical outlook and review
Posted On 01 Dec 2014
Comment: 0
EUR/USD
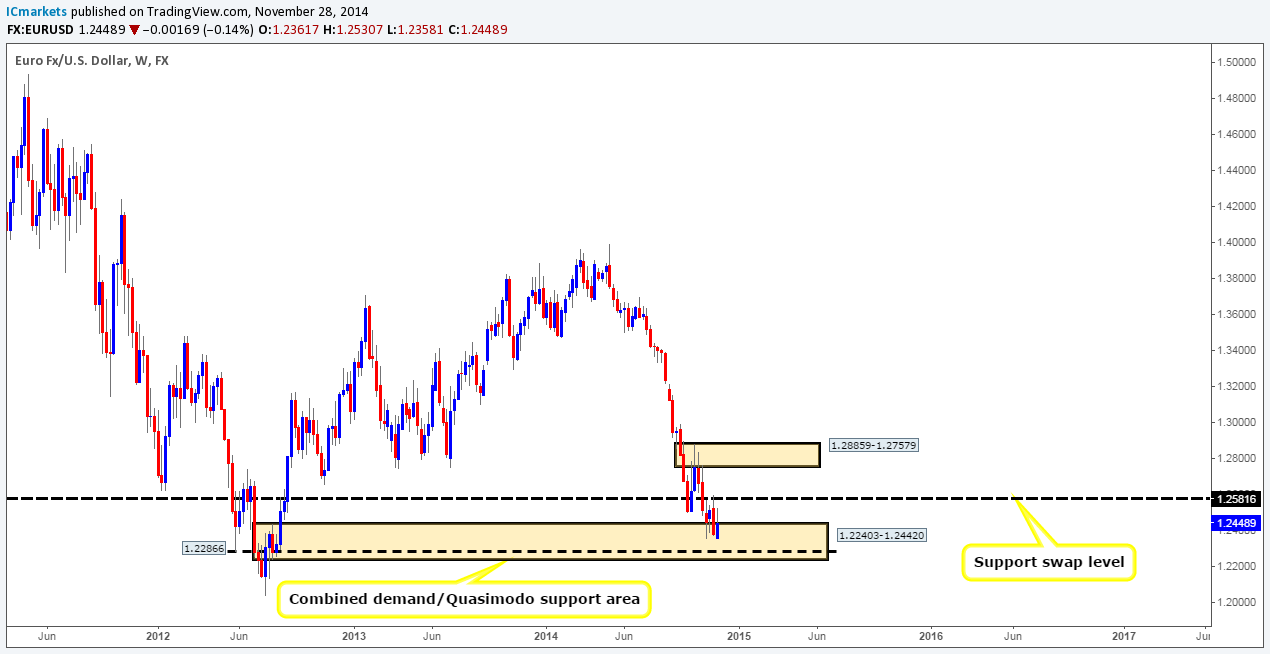
Weekly Timeframe: Overall, the buyers and sellers still remain trapped between a major combined weekly demand/Quasimodo support area at 1.22403-1.24420/1.22866, and a weekly support swap level coming in at 1.25816. The weekly candle shows that the buyers attempted to trade higher, but clearly hit selling opposition around the 1.25307 mark forcing the market to close at 1.24489.
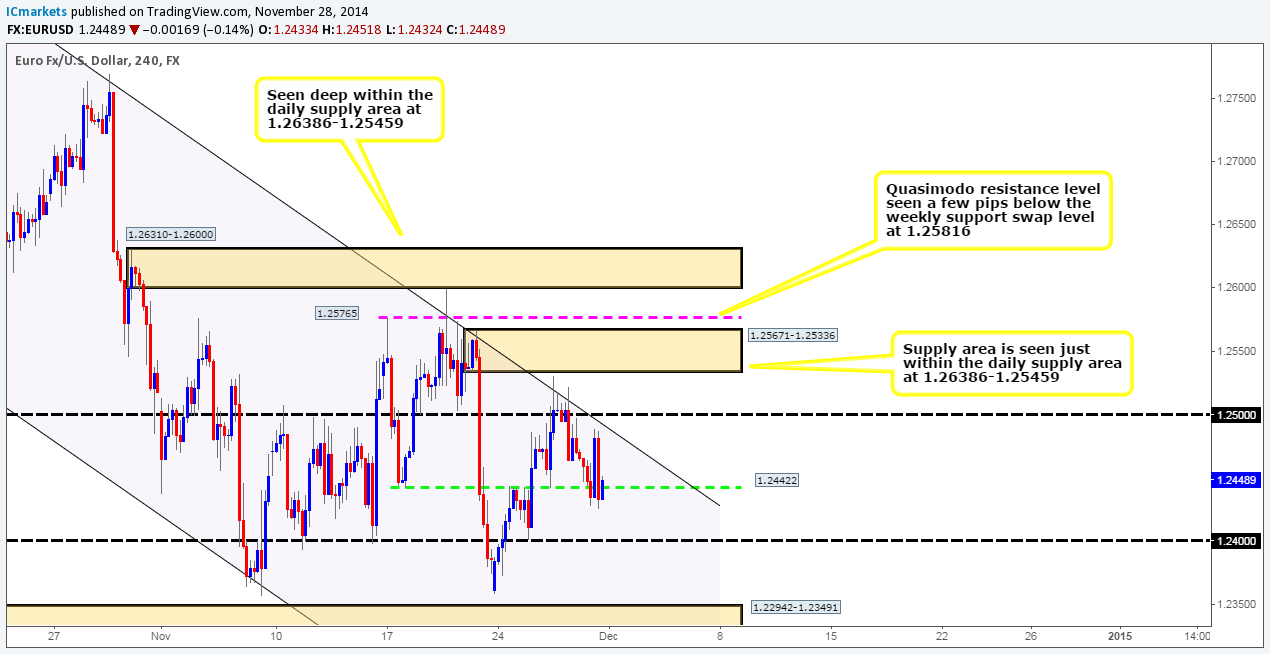
Daily Timeframe: The daily timeframe shows that price has been ranging between smaller daily supply and demand zones (1.26386-1.25459/1.22877-1.23809) within the aforementioned larger weekly areas since 06/11/2014. A break above here would do two things, one would be to clear the path north up to 1.27900, and two, it would likely confirm buying strength has entered the market from the combined weekly demand/Quasimodo support area mentioned above. A break below on the other hand would force prices deeper into the aforementioned weekly demand/Quasimodo support area, which would likely cause concern for current buyers. Let’s see what the 4hr timeframe is showing.
4hr Timeframe: On Friday, the EUR/USD pair did exactly as expected. A further decline was indeed seen down to 1.24422, which saw a bounce north. Unfortunately, we did not see any lower-timeframe confirmation signals around this area to enter long
We see the following scenario playing out today, and possibly into Tuesday. There are potentially a huge amount of stops below the round-number 1.24 just begging to be consumed. This will likely attract well-funded traders to this area as it contains something they require – liquidity, to put it another way, sell stops to buy into. Therefore, we’re expecting a fakeout below this level, and a rally higher back towards 1.24422 (now resistance), where at which point selling interest will likely enter the market.
Assuming price behaves as described above, we will try and attempt to take advantage of these short-term moves – buys are seen at 1.24050, and sells at 1.24398. However, please understand that we are not in any way considering setting pending orders here, this is probably not the best path to take since we see no higher-timeframe direction (consolidation – see above) at the moment. Lower-timeframe confirmation would be required; we will be watching the 5 minute timeframe since any higher would not offer good enough risk/reward.
Buy/sell levels:
- Buy orders: 1.24050 [Tentative] (Predicative stop-loss orders seen at: 1.23900).
- Sell orders: 1.24398 [Tentative] (Predicative stop-loss orders seen at: Dependent on where one confirms the level).
GBP/USD:
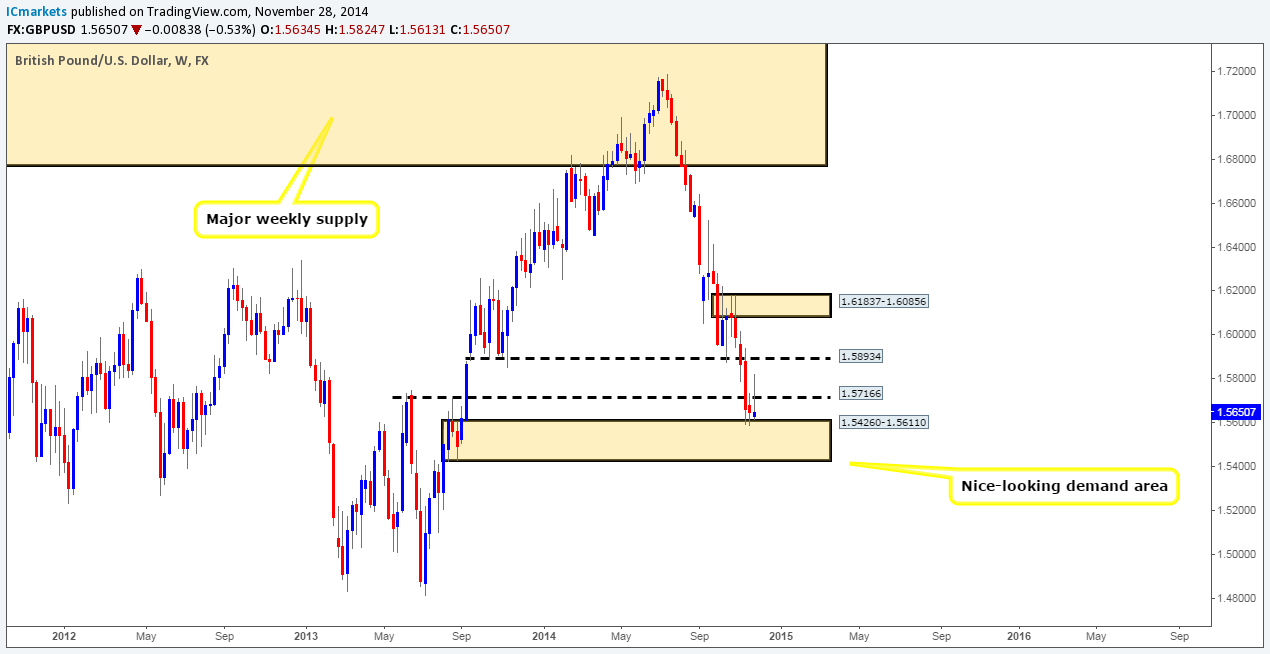
Weekly Timeframe: Things were looking fantastic for the pound at the beginning of the week as the buyers were holding prices nicely above 1.57166, where at which point we were expecting price to hit 1.58934, a weekly support swap level. However, mid-week trading saw aggressive selling enter the market which as a result formed an inverted hanging-man candle. This move has consequently forced prices back down to a weekly demand area coming in at 1.54260-1.56110. Let’s take a look at the lower timeframes to see what we can find.
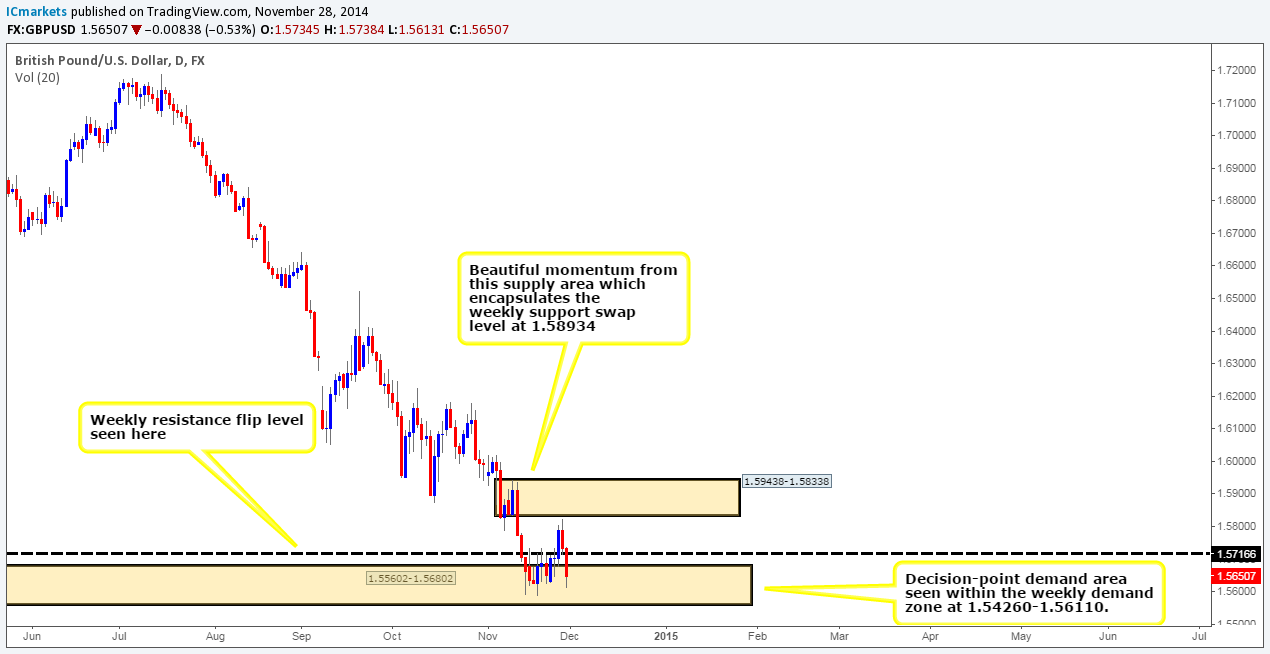
Daily Timeframe: The selling pressure that was seen last week on Thursday and Friday likely came down to a daily supply area coming in at 1.59438-1.58338, which encapsulates the weekly support swap level mentioned above at 1.58934. For higher prices to be seen on the pound, this area would need to be consumed.
At this point in time the daily timeframe shows that price is trapped between the aforementioned daily supply area, and a daily decision-point demand area coming in at 1.55602-1.56802 (located just within the weekly demand area mentioned above at 1.54260-1.56110).
4hr Timeframe: For anyone who read our previous report on the GBP/USD, you may recall us mentioning that if the 1.57208-1.56297 area failed, we should be prepared for a move south down towards a 4hr support area coming in at 1.55917-1.56299 which as we can all see happened on Friday.
Let’s just recap for a moment. The weekly timeframe is currently trading back around a weekly demand area, while the daily timeframe is showing ranging action, but is also trading around the daily demand area within that range (for levels – see above). So, with that in mind, we are favoring a move higher today and possibly into tomorrow at least up until the 4hr resistance swap area coming in at 1.57208-1.56927 (surrounds the weekly resistance swap level at 1.57166). We already mentioned on Friday to watch for lower-timeframe buying confirmation around 1.56141 within the 4hr support area mentioned above, which to our knowledge has not materialized yet. Therefore, today we’ll be keeping a close eye on the 15/5 minute timeframes to see if we can get an entry long with our first take-profit target being set at 1.56853.

Buy/sell levels:
- Buy orders: 1.56141 [Tentative] (Predicative stop-loss orders seen at: 1.55634).
- Sell orders: Flat (Predicative stop-loss orders seen at: N/A).
AUD/USD:
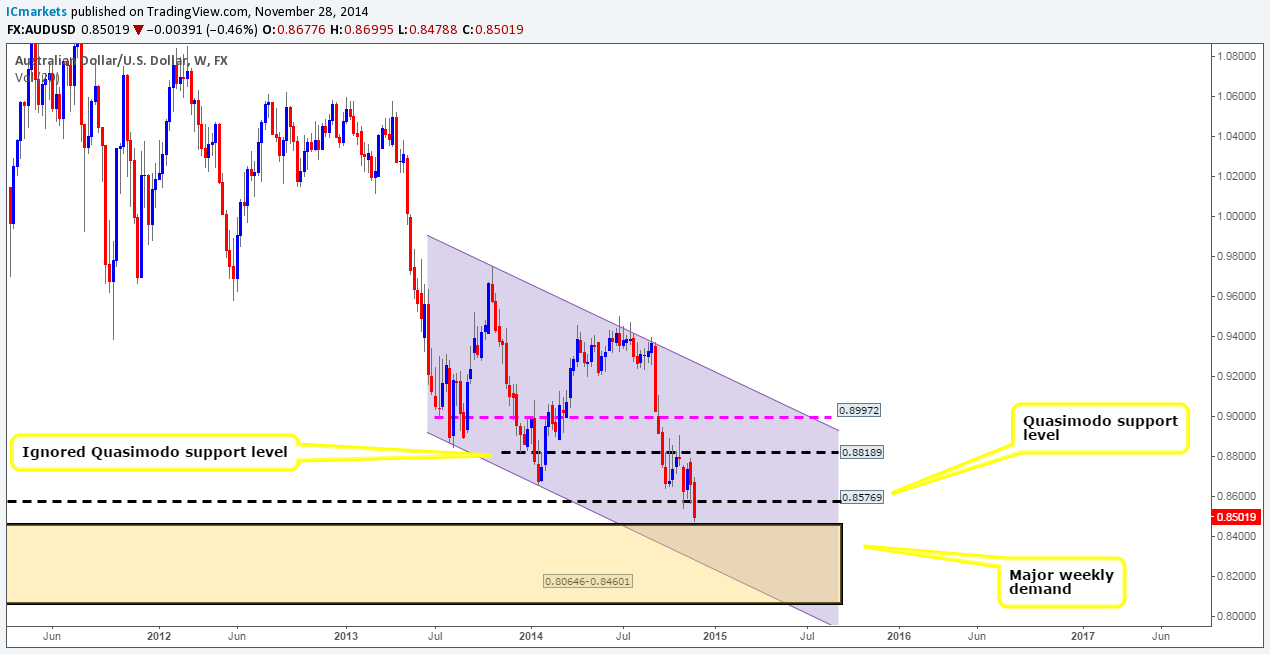
Weekly Timeframe: The weekly timeframe shows that price has been respecting the limits of a long-term down-trending channel (upper/lower limits – 0.97569/0.88468) for quite some time now. Last week saw the sellers close price below a weekly Quasimodo support level coming in at 0.85769. This move very likely cleared the path south down towards a major weekly demand area seen just below at 0.80646-0.84601.
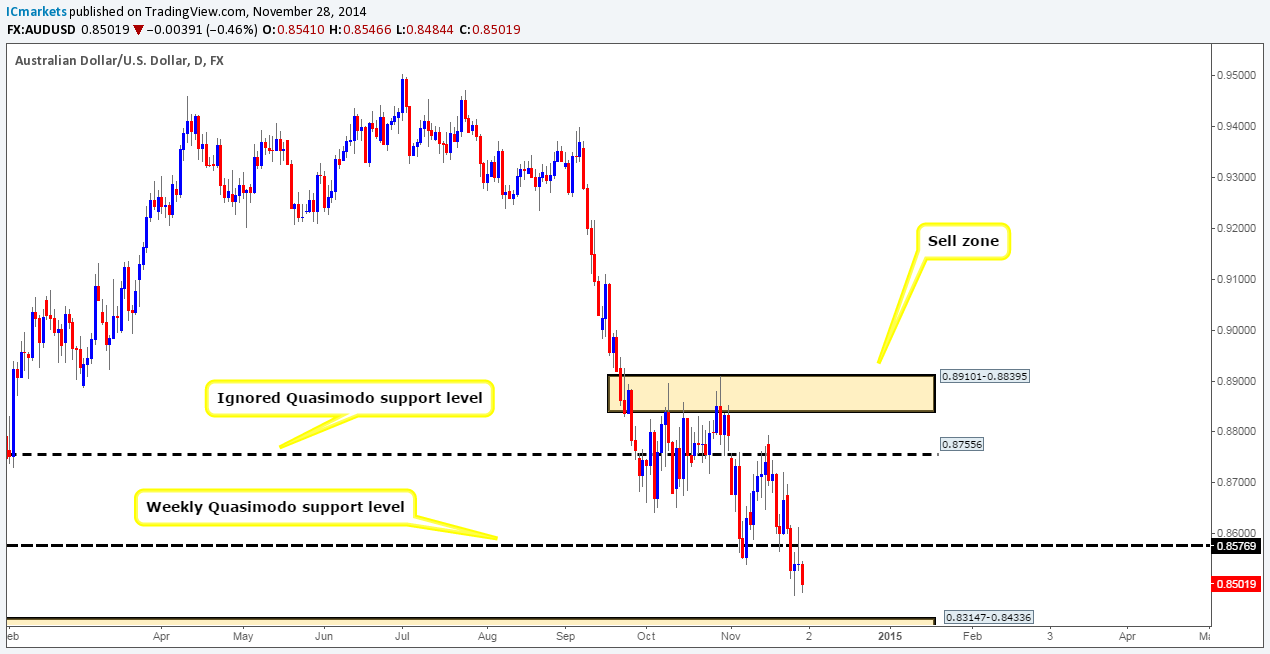
Daily Timeframe: The daily timeframe clearly shows there were active sellers around 0.85769 as further selling was seen from this resistance area on Friday. At this point in time – very similar to the weekly timeframe, we see very little stopping prices from declining further down towards a daily demand area coming in at 0.83147-0.84336 (located within the aforementioned weekly demand area). Let’s see what we can find on the 4hr timeframe.
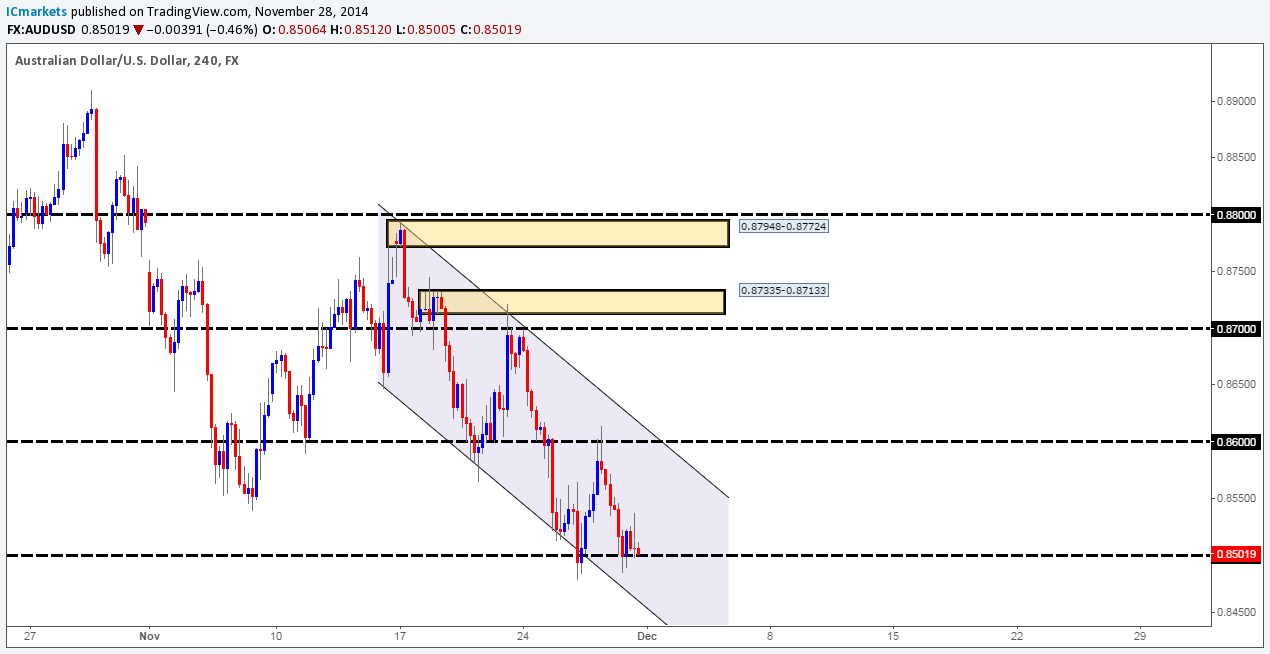
4hr Timeframe: Friday’s trading action was particularly uneventful as price ranged above the round-number level 0.85. Our team has come to the conclusion that selling this market is too risky for the time being, since we have huge higher-timeframe demand areas looming just below, as explained above. Unfortunately, we also cannot view the 4hr timeframe historical data as our feed does not extend far enough back, so we have to rely on our higher-timeframe analysis to guide us for the moment. Therefore, with the above in mind; we have decided to remain flat in this market until further price action unfolds.
The most likely scenario we see playing out today however, and possibly tomorrow, is that further selling will be seen down towards the higher-timeframe demand areas mentioned above, and assuming this does indeed happen, that will be our cue to begin looking for buying opportunities.
Buy/sell levels:
- Buy orders: Flat (Predicative stop-loss orders seen at: N/A).
- Sell orders: Flat (Predicative stop-loss orders seen at: N/A).
USD/JPY:
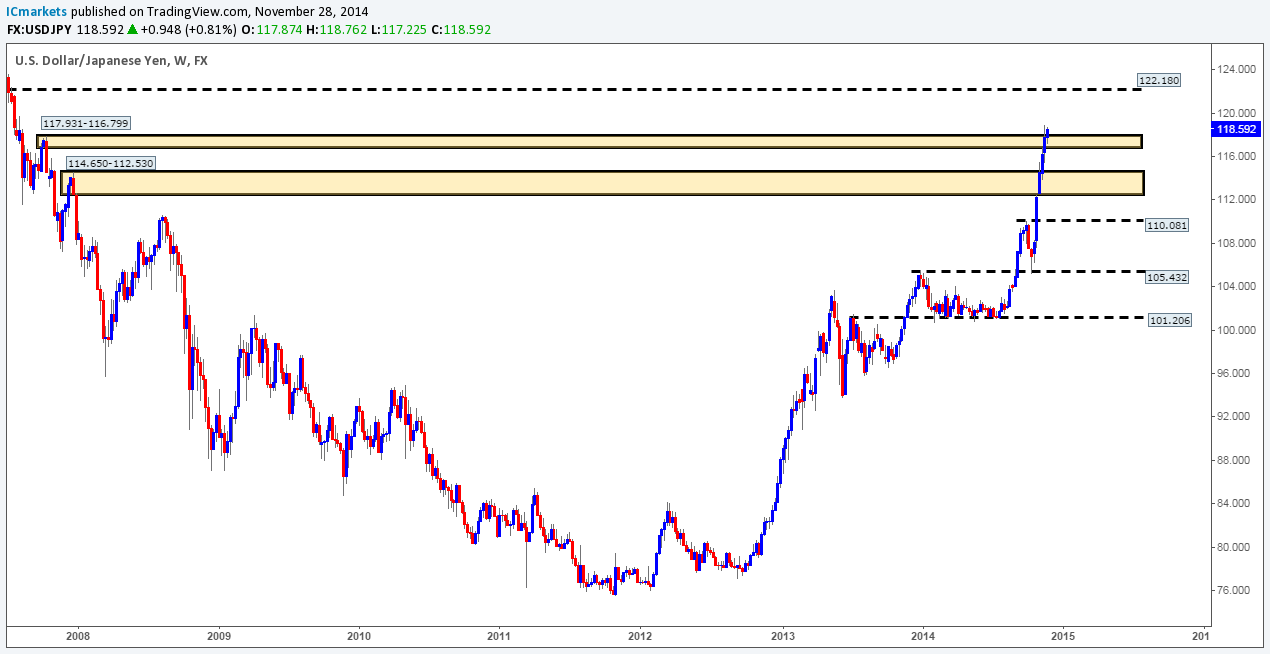
Weekly Timeframe: The week before last we asked ourselves whether a fakeout or a continuation move was being seen just above the major weekly supply area at 117.931-116.799. We may have had that question answered, as last week saw the USD/JPY close above this weekly supply area with little to no interest being seen by the sellers into the close. However, before we all go hitting the buy buttons expecting price to shoot to 122.180, let’s take a look at the lower-timeframe structure.
Daily Timeframe: The daily timeframe price action shows that for a little over a week now, the market has been trading between a daily supply area seen at 119.820-118.700 (located above the aforementioned weekly supply area), and a daily decision-point demand area at 116.326-117.040. If we bought the USD here, we would effectively be buying into daily supply, so waiting until this area is consumed may be the best path to take at the moment.
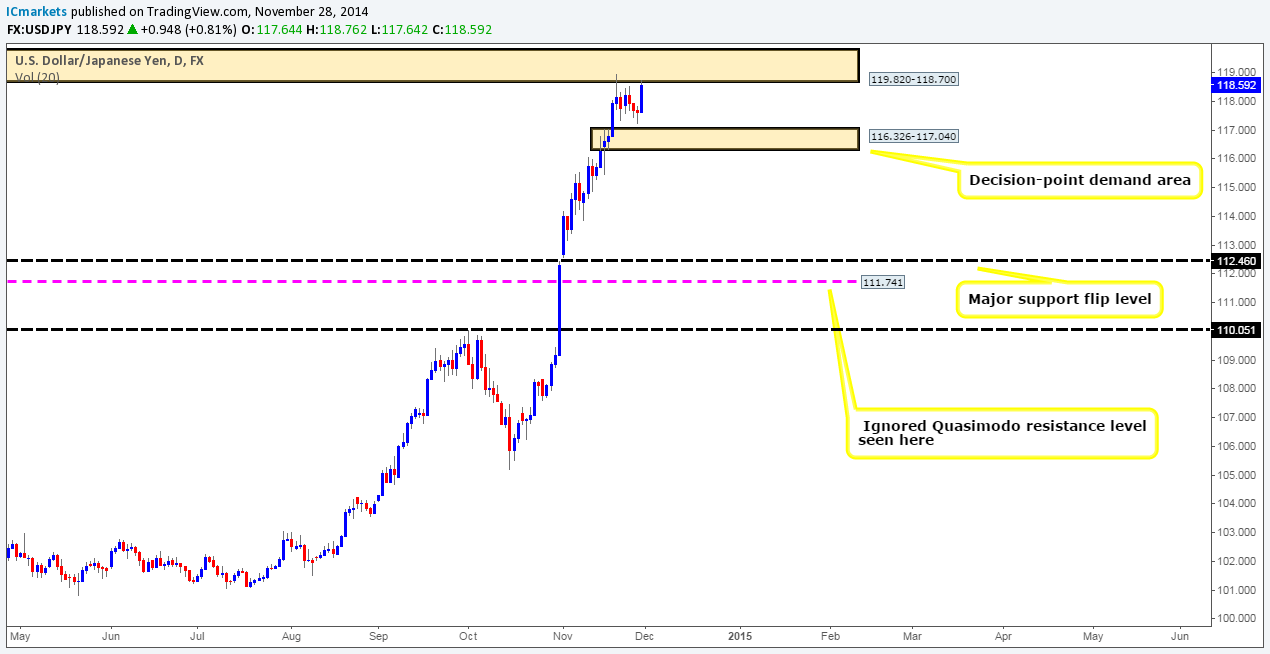
4hr Timeframe: Last week showed that the trading conditions on this pair were miserable; the torment this must have caused those who got caught up trying to buy and sell around 118 must have been immense
For us personally, we would not consider buying until price closes above 119 and successfully retests this level as support. This move would likely confirm genuine buying strength from the recently closed weekly candle, and also show that there is potentially weakness being seen within the daily supply area mentioned above at 119.820-118.700.
Given the points made above, we have decided to remain flat until further developments area seen.

Buy/sell levels:
- Buy orders: Flat (Predicative stop-loss orders seen at: N/A).
- Sell orders: Flat (Predicative stop-loss orders seen at: N/A).
USD/CAD:
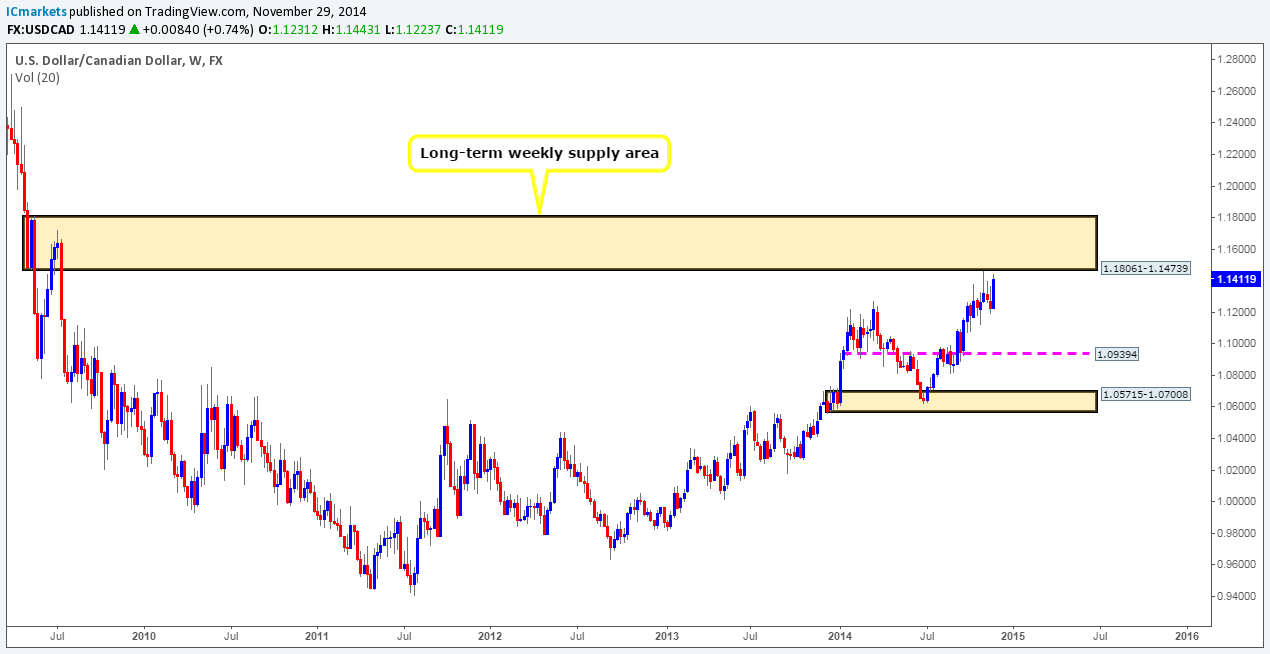
Weekly Timeframe: From the 03/11/14 – 17/11/14 price was showing bearish activity from the weekly supply area coming in at 1.18061-1.14739. It was only until last week that the buyers stepped in and rather aggressively bought the U.S Dollar, which consequently forced the market to close near its high (1.14431) at 1.14119. Let’s see what the lower timeframes have to say about this.
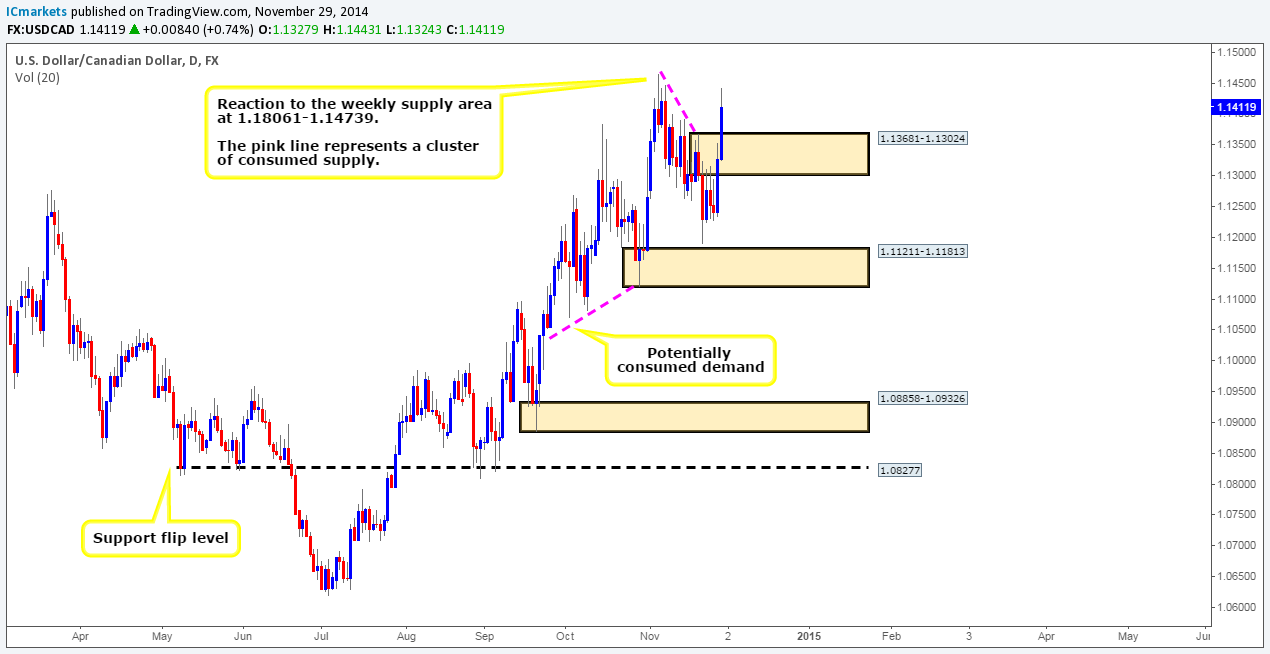
Daily Timeframe: It was mentioned in Friday’s analysis that if price were to break above the daily supply area at 1.13681-1.13024, then the market would likely trade back up to the aforementioned weekly supply area. In our opinion, one of the reasons why price could rally like this was simply because there was consumed supply to the far left marked by a pink downtrend line. A break above 1.14655 would likely attract further buying up towards a major daily supply area seen at 1.17225-1.15458 (located deep within the weekly supply area mentioned above).
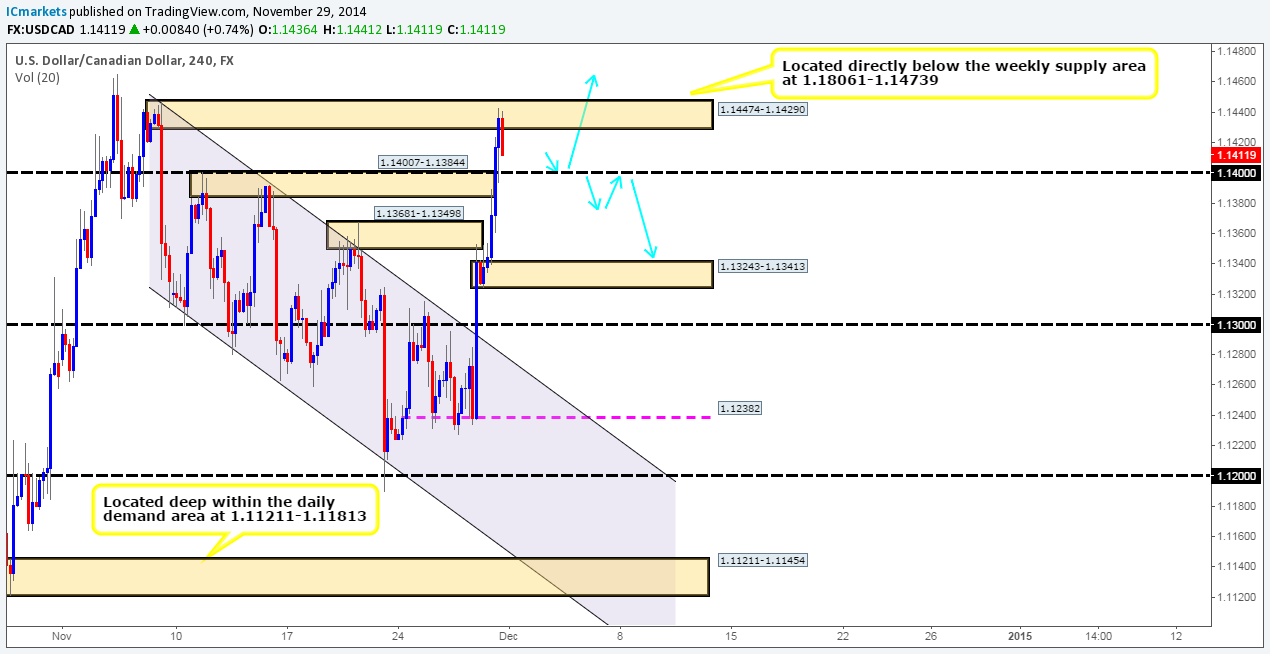
4hr Timeframe: The U.S Dollar made significant gains against the Canadian Dollar on Friday, as price rallied over 100 pips. This move absolutely obliterated two 4hr supply areas (1.13681-1.13498/1.14007-1.13844), and only showed signs of slowing down at a 4hr supply area coming in at 1.14474-1.14290 (located below the aforementioned weekly supply area) just before the market closed.
In our view, price can do either one of two things:
- The sellers can close price below 1.14000, which will likely clear the path south down towards a very important 4hr decision-point demand area seen at 1.13243-1.13413. Assuming that a close below is indeed seen, this will be our cue to begin watching price action for a possible retest opportunity of 1.14000 as resistance, targeting 1.13454 (as per the blue arrows). The reason why we believe this area to be important is simply because this is likely where pro money made the decision to break above the daily supply area at 1.13681-1.13024.
Or
- A small decline in value could be seen down toward 1.14000, where buying interest will likely be seen. This could force the market to push above the aforementioned 4hr supply area, where at which point our team would begin looking for long opportunities with an overall long-term take-profit target set around the daily supply area mentioned above at 1.17225-1.15458. However, do bear in mind that price would at that point be trading deep within a weekly supply area (see above), so any trades taken long would need strict trade management rules.
Buy/sell levels:
- Buy orders: Flat (Predicative stop-loss orders seen at: N/A).
- Sell orders: Flat (Predicative stop-loss orders seen at: N/A).
DAX 30:
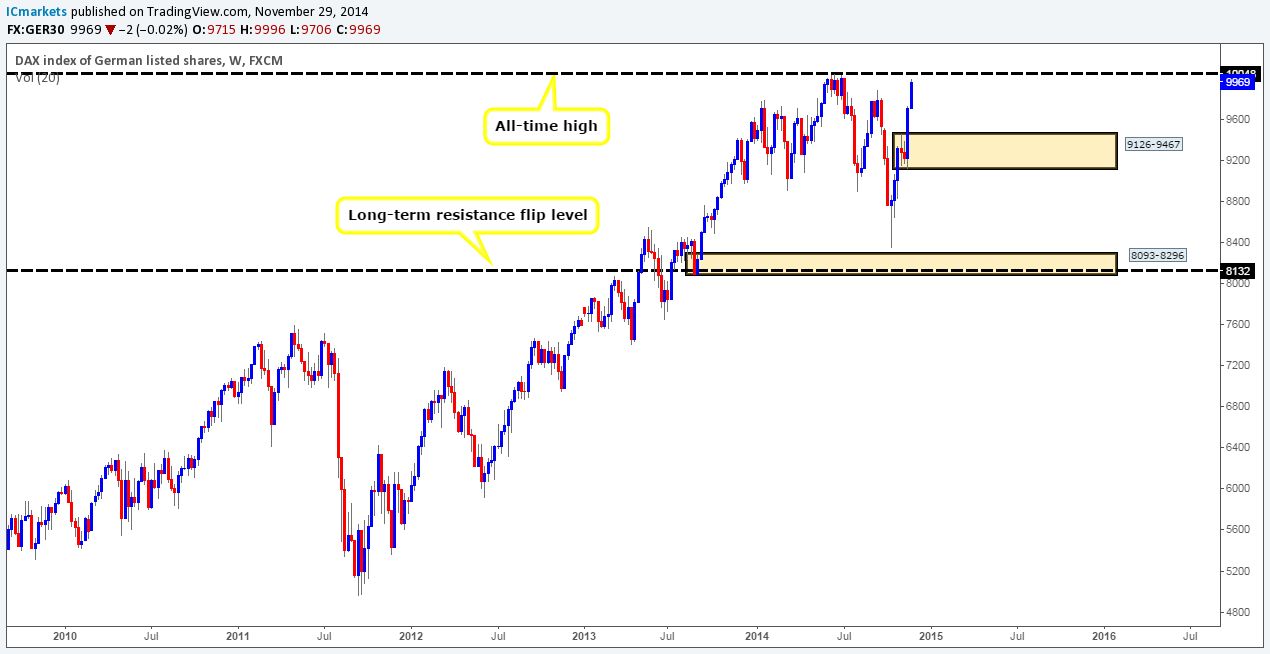
Weekly Timeframe: The weekly timeframe shows that the buyers have been well and truly in control for the past two weeks, which has consequently forced price to close (9969) just below an all-time high seen at 10048. A break above here would likely attract further buying, which in turn would see the DAX continue on its near three-year uptrend.
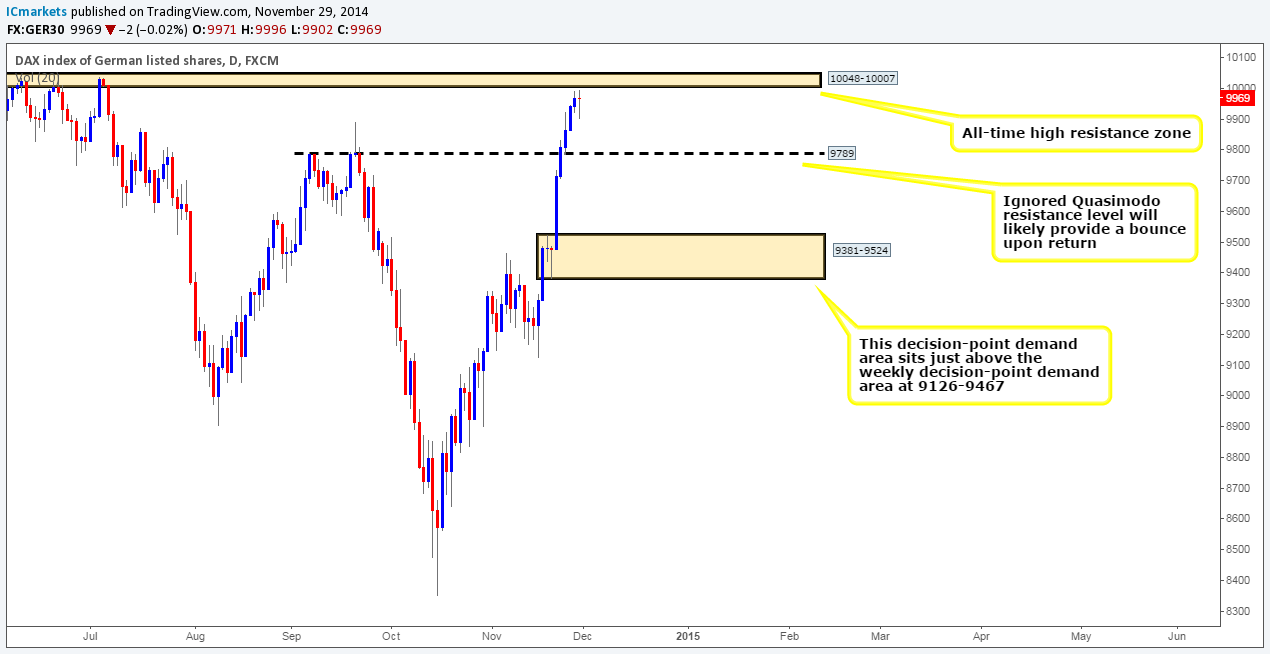
Daily Timeframe: The daily timeframe shows that price closed just below a clear resistance zone at 10048-10007 around the all-time high (see above). In the event that selling interest comes into the market here, we can likely expect prices to decline in value down towards an ignored daily Quasimodo resistance level seen at 9789. Let’s see what we can find on the 1hr timeframe.
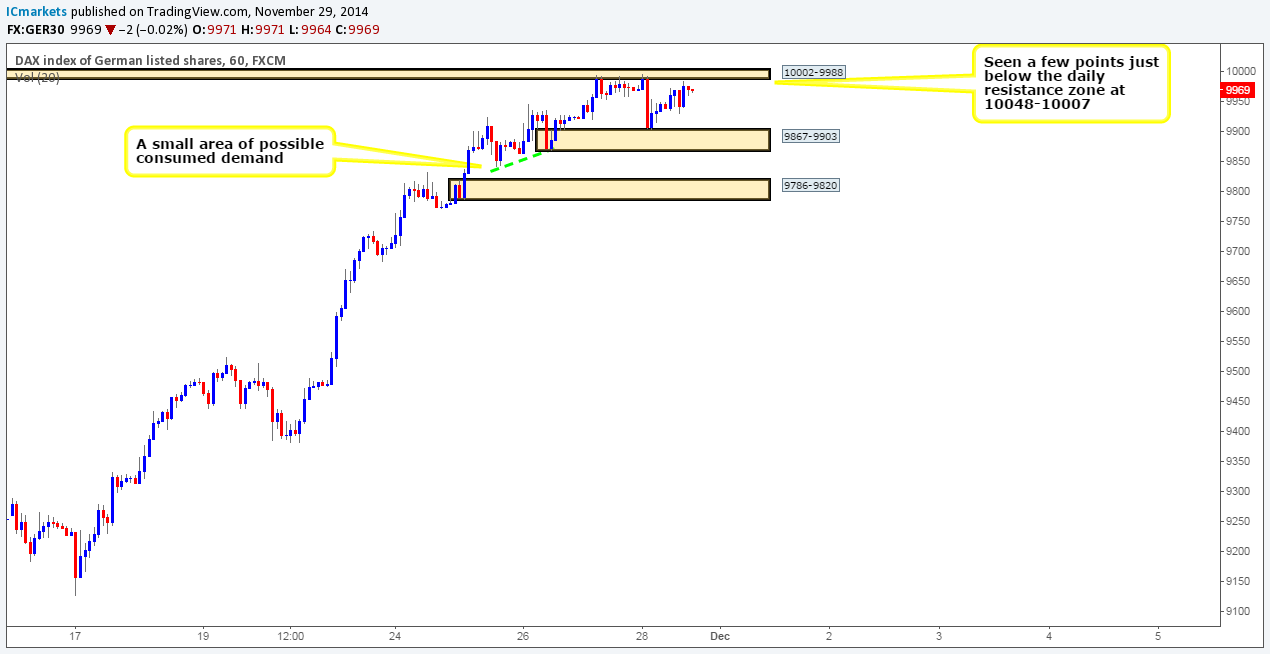
4hr Timeframe: The DAX is currently caught trading in between a small 1hr supply area coming in at 10002-9988, and a 1hr demand area seen at 9867-9903. Range traders may want to consider buying and selling the limits with buys seen at 9908, and sells at 9983. Trading these levels blindly with pending orders may not be the best path to take, we would recommend waiting for lower-timeframe confirmation here before pulling the trigger.
Assuming that price breaks out north here, we would not consider this to be a buy signal since all price would have effectively done was trade into the higher-timeframe resistance mentioned above. A break below on the other hand could be an early signal that a sell off may well be seen down towards a 1hr demand area coming in at 9786-9820. The reason why price could potentially drop thus far is because to the left marked with a green trendline we see consumed demand.
Buy/sell levels:
- Buy orders: 9908 [Tentative] (Predicative stop-loss orders seen at: 9864).
- Sell orders: 9983 [Tentative] (Predicative stop-loss orders seen at: 10011).
DOW 30:
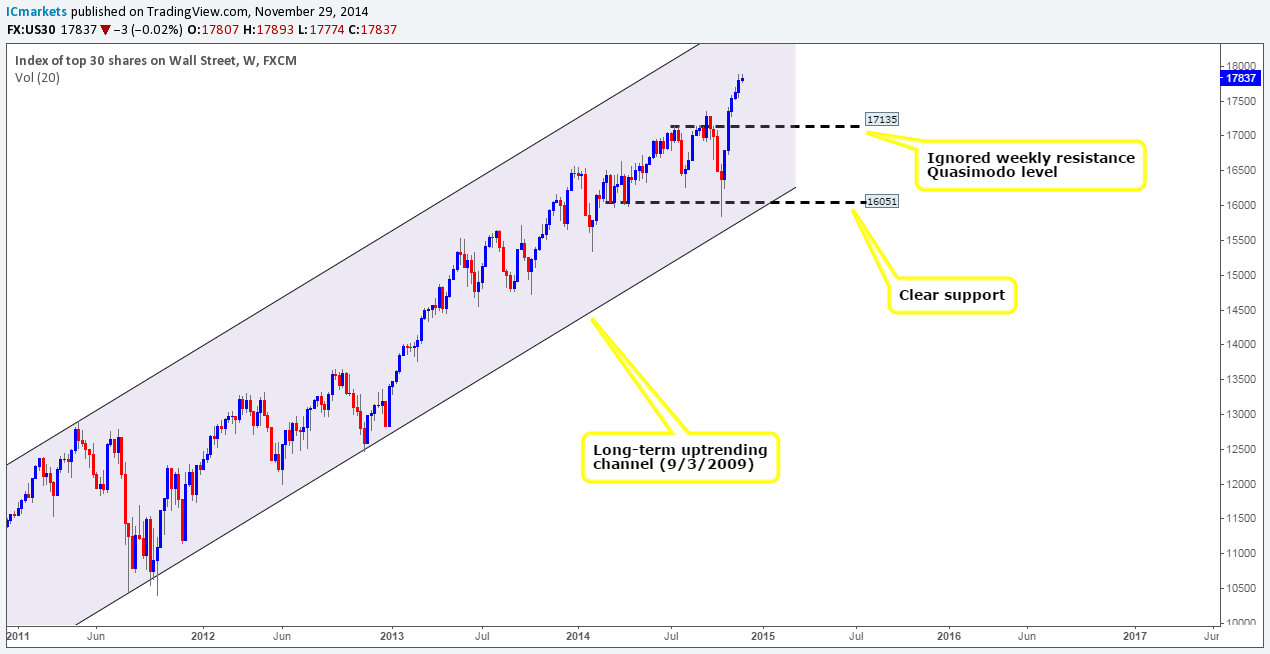
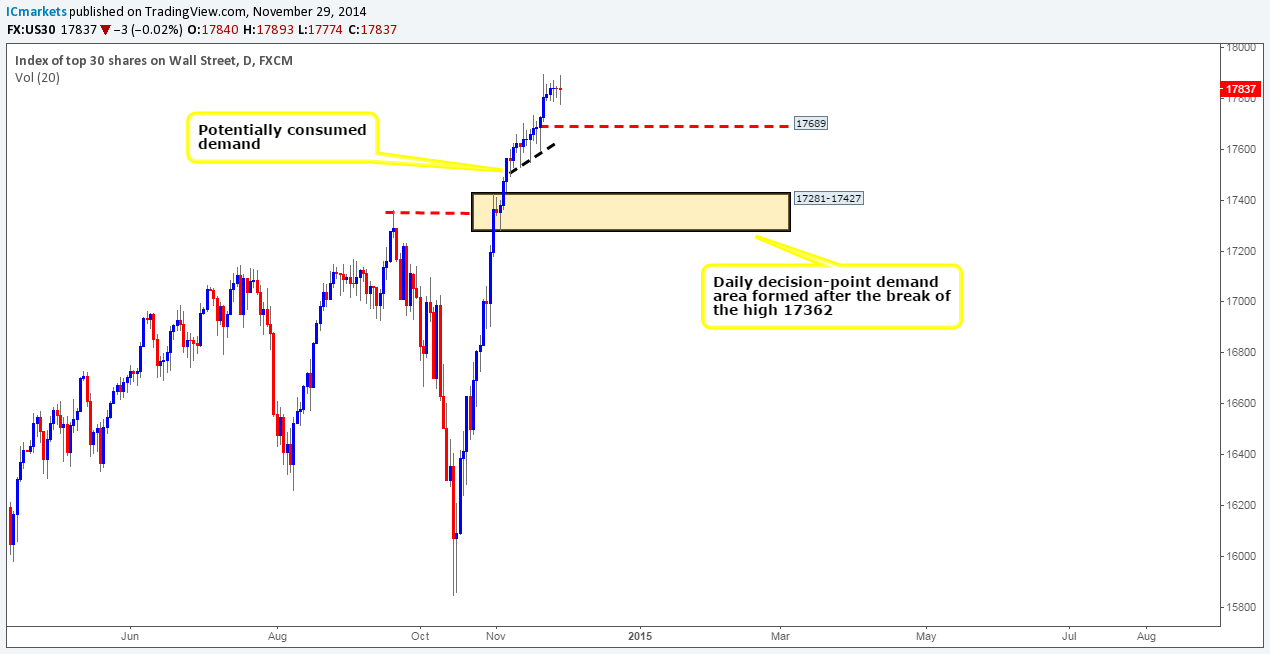
Weekly Timeframe: The DOW has been trading beautifully within a nice-looking trending channel for over five years now. The recently closed weekly candle shows that the upward momentum may be fading for the moment, as price failed to make a new higher high which as a result formed an inside candle. Let’s take a look at the lower timeframes to see what we can find.
Daily Timeframe: The daily timeframe shows a small five-day range which was caused by the weekly inside candle. It also shows that if active sellers come into this market and break below 17689, we could likely see a sell off down towards a daily decision-point demand area coming in at 17281-17427, since just below, there seems to be very little active demand. Hopefully we’ll see more information on the 1hr timeframe.
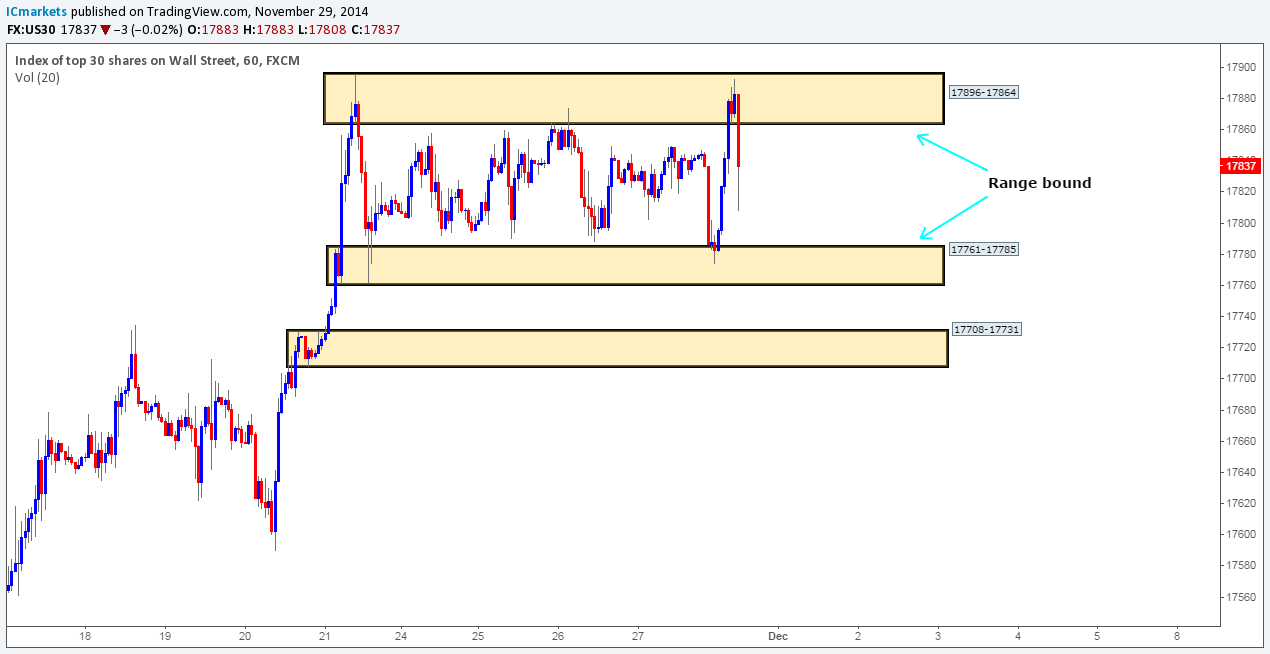
1hr Timeframe: The 1hr chart clearly shows that the DOW is ranging between a 1hr supply area at 17896-17864, and a 1hr demand area seen at 17761-17785.
Here is how we intend to trade this market:
- In our opinion, trading the range is a valid strategy with potential buys being seen at 17788, and sells at 17862. Be that as it may, we will not be pulling the trigger here until we have lower-timeframe confirmation.
- Assuming that price breaks out north here, this will be our cue to begin looking for buying opportunities to join this long-term uptrend.
- Likewise, if price breaks lower, we would then be on the lookout for selling opportunities down to the next area of interest, a 1hr decision-point demand area coming in at 17708-17731 (located just above the daily 17689 level).
Buy/sell levels:
- Buy orders: 17788 [Tentative] (Predicative stop-loss orders seen at: 17757).
- Sell orders: 17862 [Tentative] (Predicative stop-loss orders seen at: 17899).
XAU/USD (GOLD):
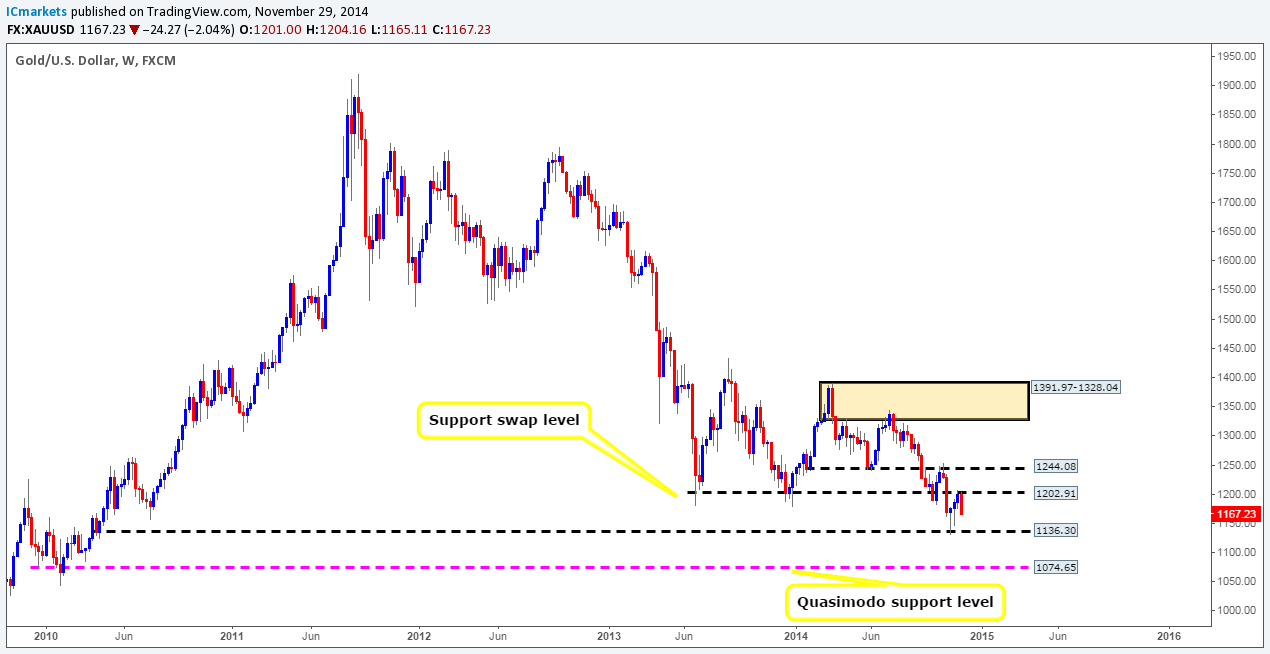
Weekly Timeframe: In all honesty, we did not expect there to be that much selling interest around the weekly support swap level at 1202.91, clearly there was, as price broke below the previous week’s low seen at 1174.96. As per this timeframe, the buyers and sellers are currently trapped between 1202.91 and a weekly decision-point demand level coming in at 1136.30. Let’s see what we can find on the lower timeframes.
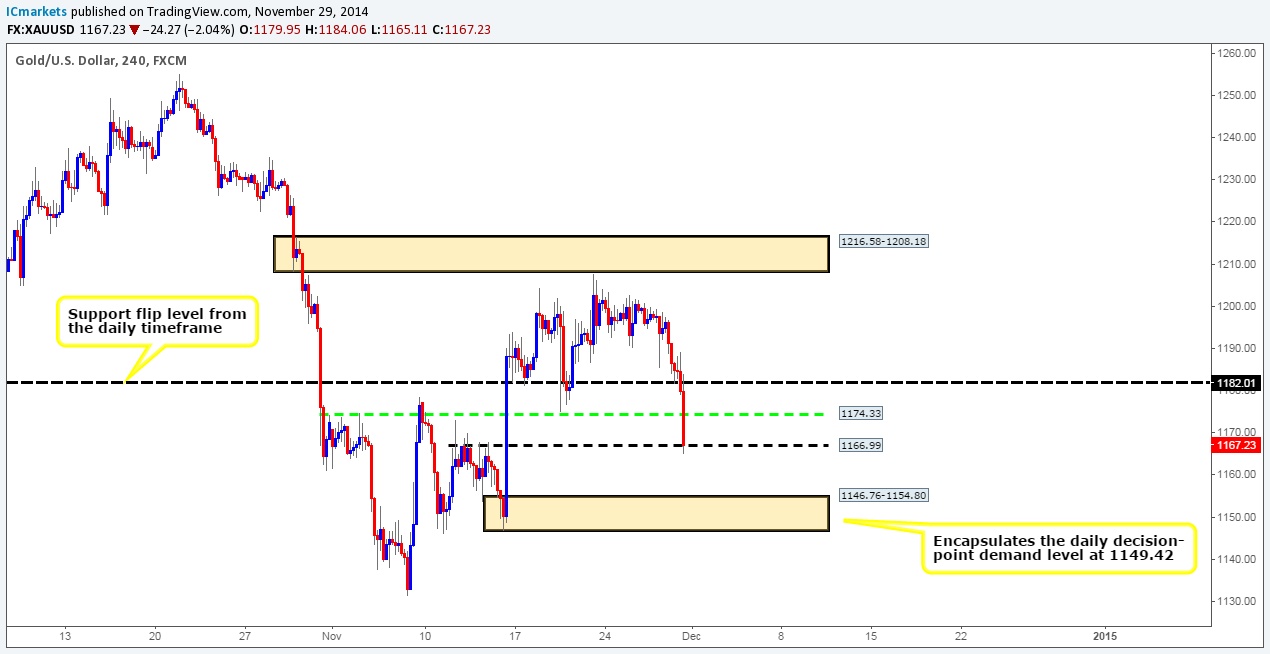
Daily Timeframe: For anyone who follows our analysis on a regular basis, you may recall us mentioning that if price significantly closed below 1182.01, our bias would therefore not remain long. As we can all see, on Friday this did indeed happen, and as such, this has likely cleared the path south down towards an area of support seen at 1149.42. It will be interesting to see what the 4hr timeframe shows.
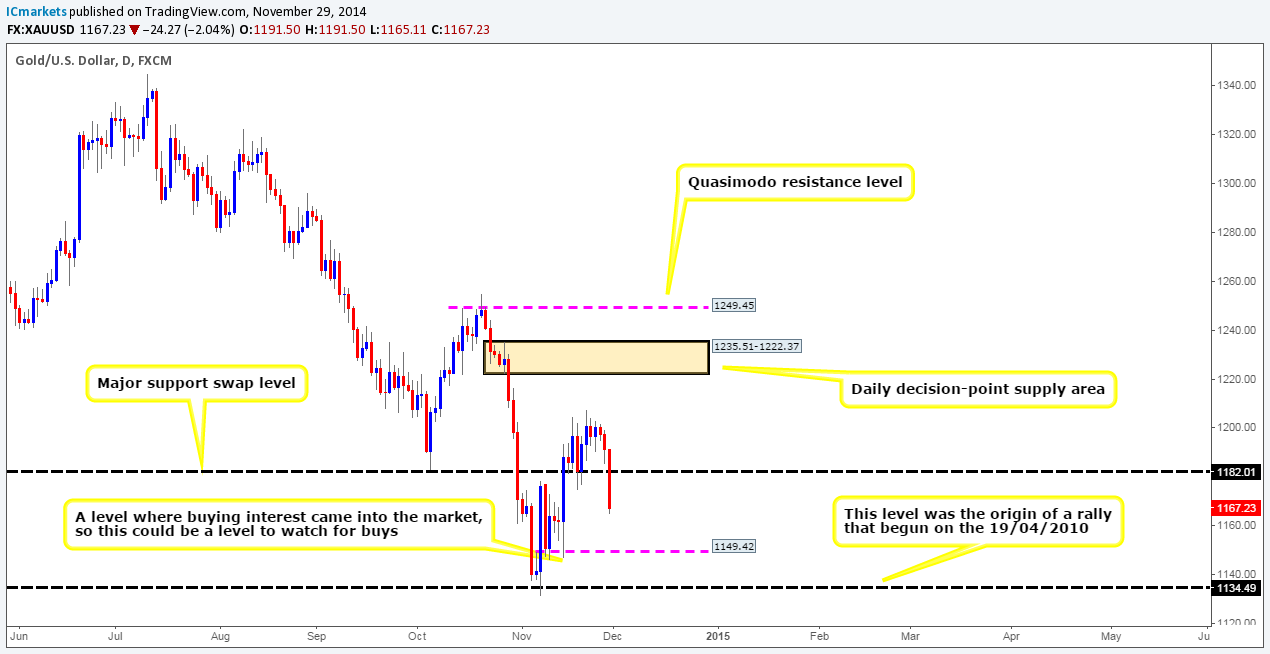
4hr Timeframe: The 4hr timeframe shows that just before the market closed on Friday, the sellers aggressively sold price past 1174.33 into a minor 4hr resistance flip level seen at 1166.99. Buying here may not be the best path to take for two reasons:
- Price has just reacted off of a weekly support swap level at 1202.91, and broke a major daily support swap level coming in at 1182.01.
- Risk/reward considerations argue against entering long here with prices in close proximity to potential resistance (1174.33).
Assuming that price breaks below 1166.99, which we believe it very likely will, the path south is then potentially free down to a 4hr demand area coming in at 1146.76-1154.80 (encapsulates the daily decision-point demand level at 1149.42). In the event that the above is seen, we would firstly attempt to try and enter short at a possible retest of 1166.99 (tentative sell orders are seen just below at 1166.27), and then consider buying around the 1156.07 (just above the aforementioned 4hr demand area) mark which would be where we’d exit our short position.
Both trades will require lower-timeframe confirmation in our opinion. The reason why we would not enter here with a straight pending buy order is simply because price may ignore this area of demand, and trade into the more attractive higher-timeframe weekly decision-point demand level seen just below at 1136.30.
Buy/sell levels:
- Buy orders: 1156.07 [Tentative] (Predicative stop-loss orders seen at: 1145.87).
- Sell orders: 1166.27 [Tentative] (Predicative stop-loss orders seen at: Dependent on where one confirms this level).
Source:: Monday 1st December: Weekly technical outlook and review


