
Previous Story
Monday 24th November: Weekly technical outlook and review (Japanese bank holiday today).
Posted On 23 Nov 2014
Comment: 0
EUR/USD:
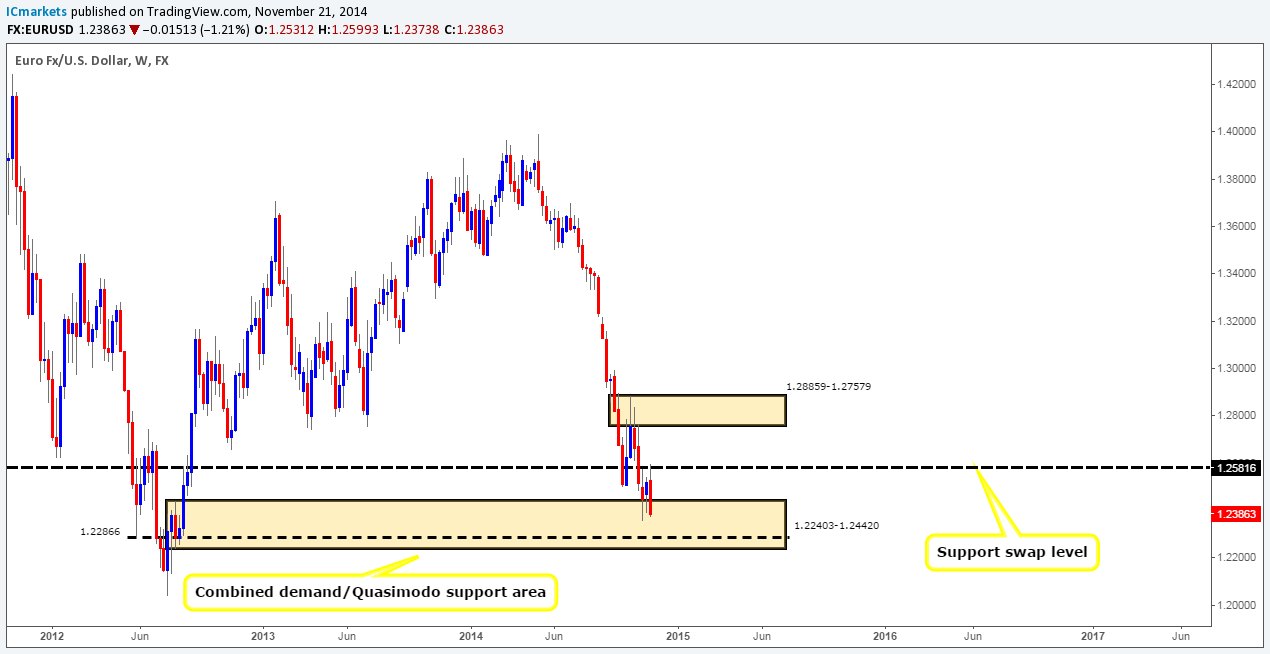
Weekly Timeframe: The situation on the weekly timeframe shows that the buyers seemingly lost steam after hitting the 1.25816 mark, a major weekly support swap level. As a consequence, this has forced the market back down into the combined weekly demand/Quasimodo support area at 1.22403-1.24420/1.22866 where price initially came from.
Daily Timeframe: *New outlook* Price is currently capped between a daily supply area at 1.26386-1.25459 (surrounds the aforementioned weekly support swap level), and a long-term daily demand area coming in at 1.22877-1.23809 (located relatively deep within the aforementioned combined weekly demand/Quasimodo support area).
A break below could spell trouble for anyone who has bought the Euro. The reason being is simply because this would likely force the market down towards a daily demand area seen at 1.21326-1.22234, which would result in price trading below the weekly demand/Quasimodo support area. Likewise, a breakout north could potentially attract further buying up to the 1.27900 hurdle, a daily Quasimodo resistance level, and as such likely confirm buying strength within this market.
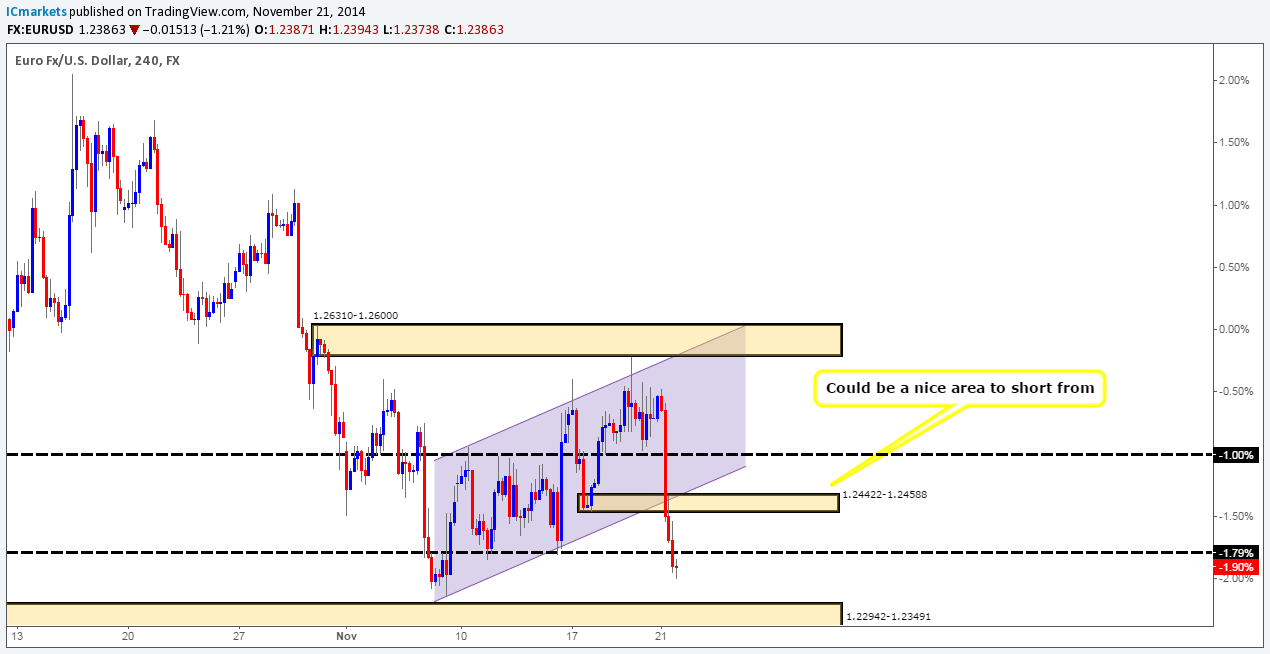
4hr Timeframe: The EUR/USD pair as we can see broke lower. We are quite sure this selling was fuelled by Draghi’s (ECB President) speech around the London open. Anyway, this momentum south has obliterated multiple support barriers, and broke below the up-trending channel. So, how do we see the market moving throughout the week? Half of the team are looking for sells considering the Euro has been trending south for longer than we can remember, while the other half are looking for buys, since price is currently located around higher-timeframe demand (see above).
We have decided that any trades taken on this pair WILL require lower-timeframe confirmation. With that in mind, tentative buy orders are seen around 1.23527, just above a combined 4hr demand/round-number area at 1.22942-1.23491/1.23. On the other hand, possible selling pressure may come into the market around 1.23980, just below the round number 1.24. In the event that price fails here and a rally higher ensues, a nice-looking level to short from comes in at 1.24401, just below a 4hr demand swap area at 1.24422-1.24588, which has the lower limits of the channel providing extra resistance.
Buy/sell levels:
- Buy orders: 1.23527 [Tentative] (Predicative stop-loss orders seen at: 1.24358).
- Sell orders: 1.23980 [Tentative] (Predicative stop-loss orders seen at: Dependent on how one confirms the level) 1.24401 [Tentative] (Predicative stop-loss orders seen at: 1.24657).
GBP/USD:
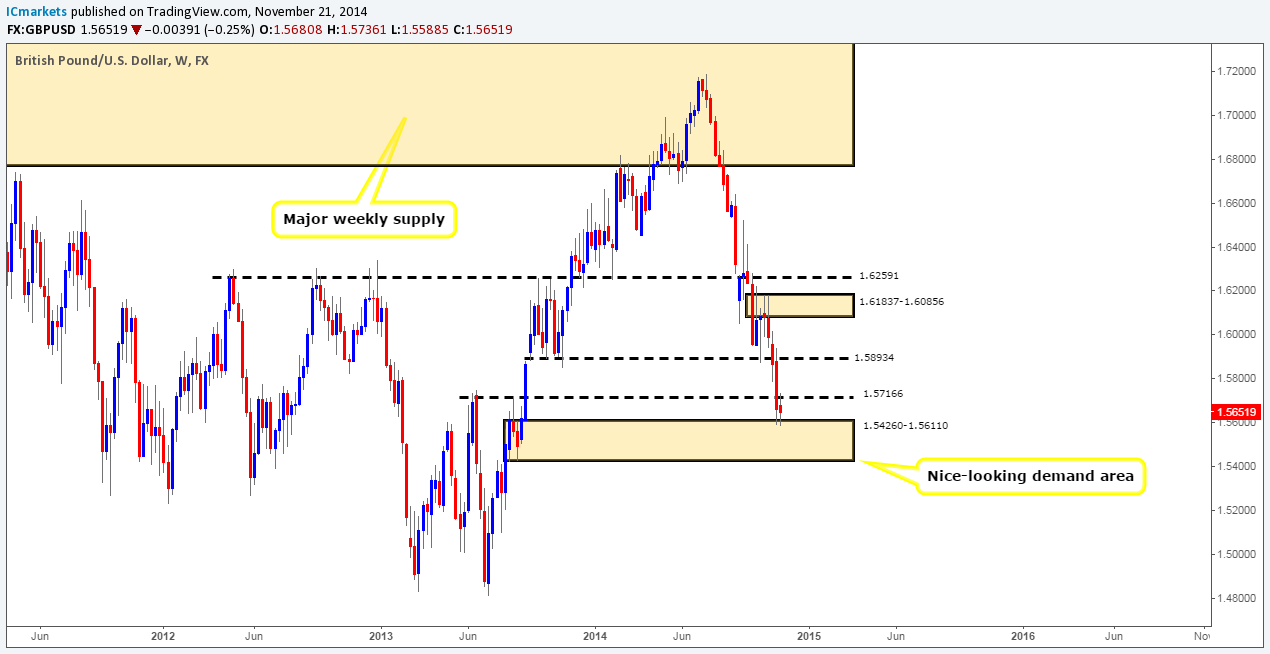
Weekly Timeframe: Last week’s price action shows it was pretty uneventful on the GBP/USD. Price was contained between a weekly demand area seen at 1.54260-1.56110, and a weekly resistance swap level coming in at 1.57166. As a consequence, an indecision candle formed. Let’s see what the lower timeframes can offer us.
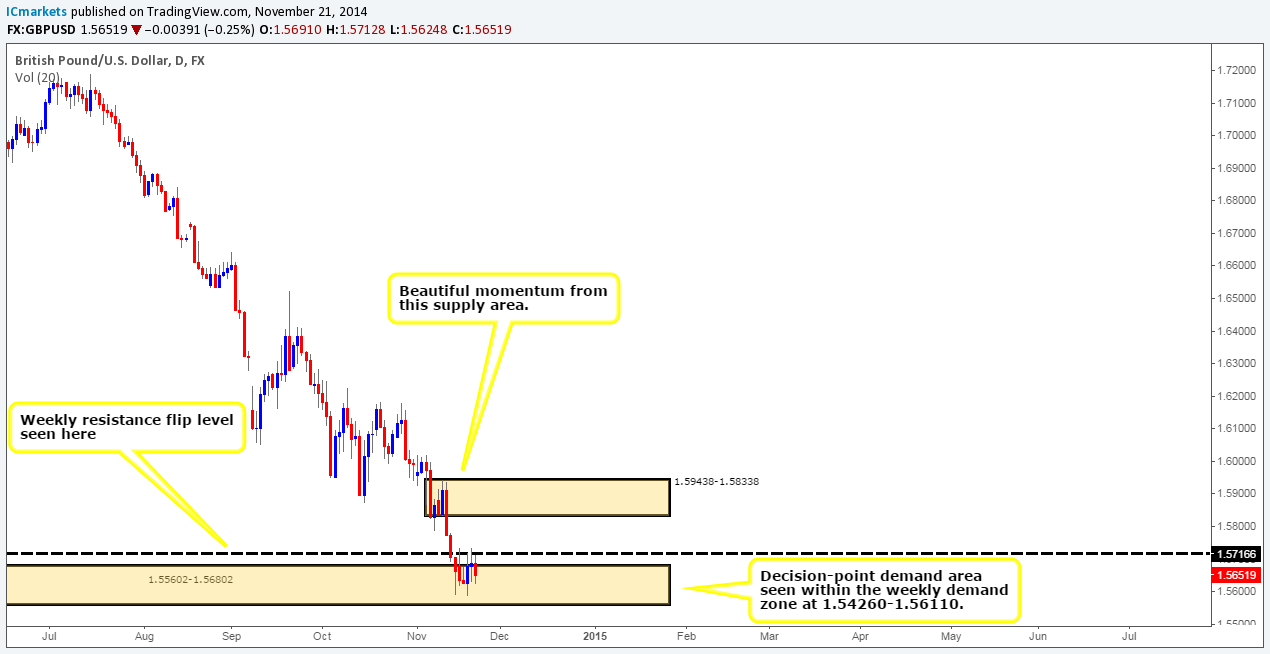
Daily Timeframe: The daily timeframe unfortunately shows very little other than the fact that last week was certainly a slow one.
At the time of writing, price is still trading within a daily decision-point demand area at 1.55602-1.56802 (located within the weekly demand area mentioned at 1.54260-1.56110). Nonetheless – like the weekly timeframe, the 1.57166 resistance barrier is currently holding the market lower resulting in tight ranging action being seen.
A close above here would need to be seen before we would consider taking any longer/medium-term buy positions on this pair. A close below on the other hand could potentially signal buying weakness within the weekly demand area, since price could potentially decline down to as far as 1.54344, a daily resistance swap level.
4hr Timeframe: For anyone who follows our analysis on a regular basis, you may recall us having an active buy position (1.56166) on the pound. We have now closed at 1.56808 for two reasons – price was not making any progress on the higher timeframes in that it was not showing us any direction north, and secondly, it was Friday, and we were not comfortable leaving the position open over the weekend.
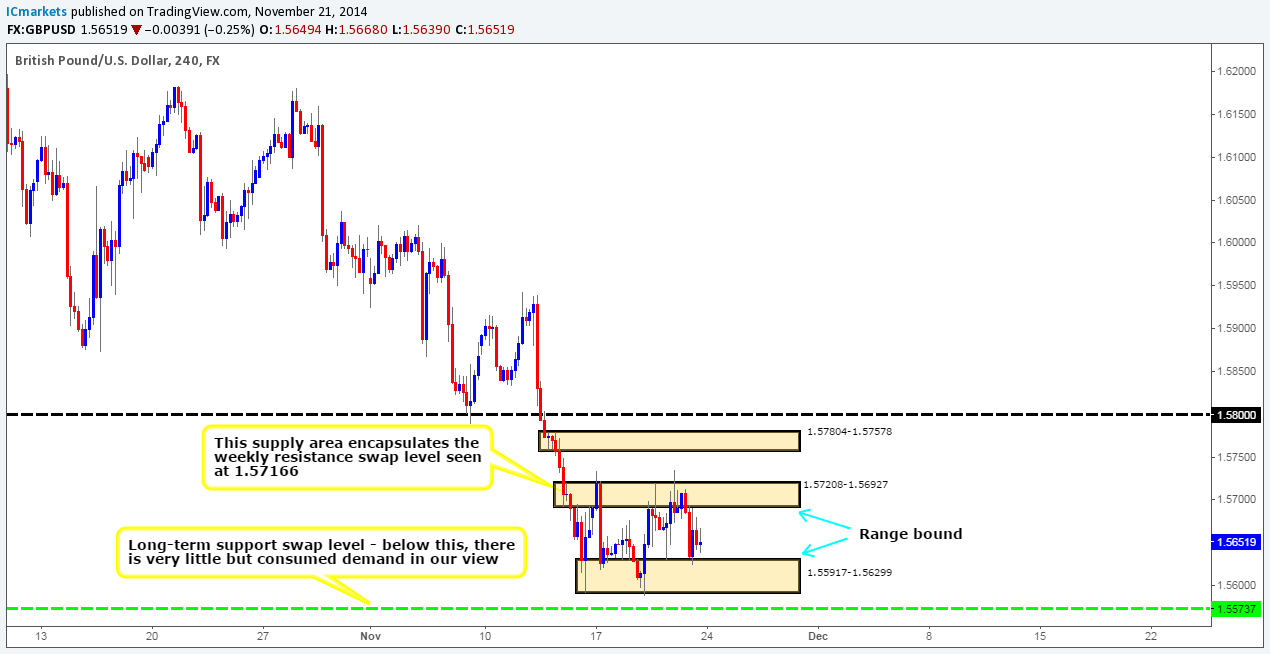
In our opinion, the GBP/USD is in a state of consolidation right down from the weekly to the 4hr timeframe. The 4hr timeframe shows dreamy price action for range traders due to the market being firmly trapped between a 4hr supply area at 1.57208-1.56927 (surrounds the weekly resistance swap level at 1.57166) and a 4hr demand area seen at 1.55917-1.56299 (located within both weekly and daily demand – see above). Tentative buy orders are seen around 1.56340, and sells at 1.56887. Using lower-timeframe confirmation to enter here is recommended, as it will probably save you from unnecessary losses that may occur if a fakeout is seen.
A break above the current range would likely force prices up to a 4hr supply area coming in at 1.57804-1.57578, and at the same time likely confirm some buying strength has entered the market from the aforementioned higher-timeframe demand areas. Conversely, a break lower would almost immediately see prices trading around 1.55737, a 4hr long-term support swap level. We will certainly be watching the lower timeframe action at this level for an entry long around 1.55759. In the event that price breaks below this level, buyers will likely be in serious trouble as the next area of demand comes in at 1.55, take a look to the left and see why. Demand appears to have already been consumed – demand consumption tails are seen at 1.55802/1.55208.
Buy/sell levels:
- Buy orders: 1.56340 [Tentative] (Predicative stop-loss orders seen at: 1.55816) 1.55759 [Tentative] (Predicative stop-loss orders seen at: Dependent on how one confirms this level).
- Sell orders: 1.56887 [Tentative] (Predicative stop-loss orders seen at: 1.57400).
AUD/USD:
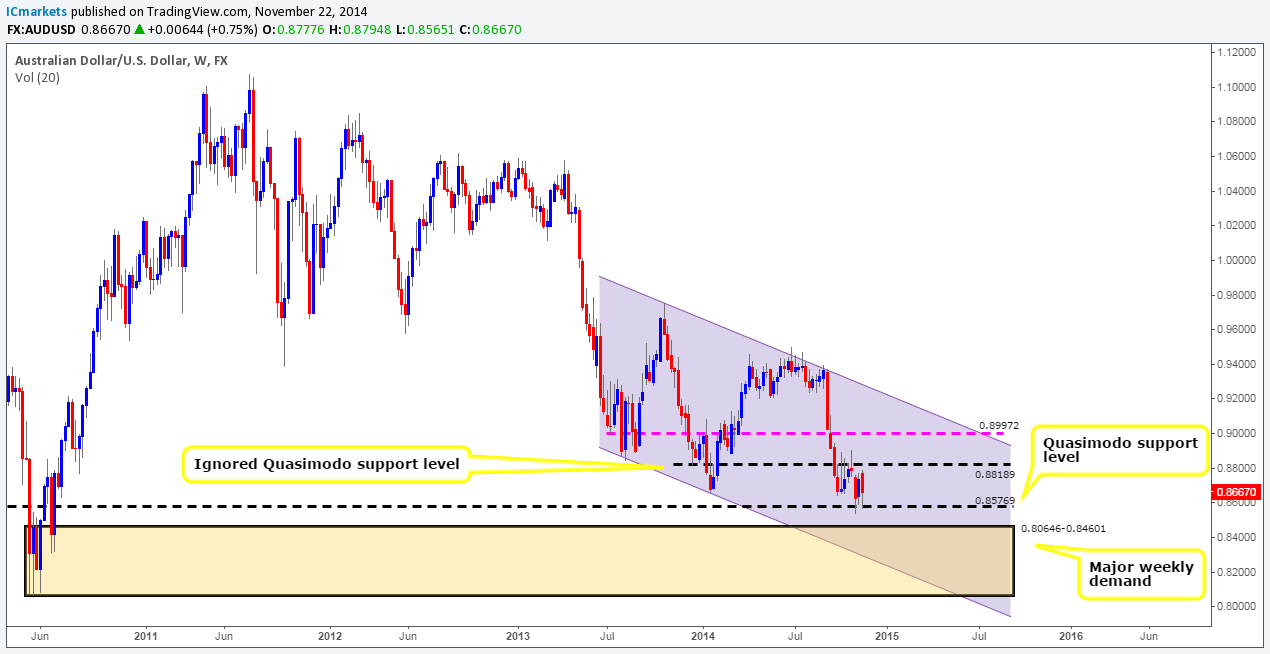
Weekly Timeframe: The weekly timeframe currently shows that price is respecting the limits of a long-term down-trending channel (lower limit – 0.88468 upper limit – 0.97569) at the moment. However, for the time being the buyers and sellers have been seen battling it out between an ignored weekly Quasimodo support level seen at 0.88189, and a weekly Quasimodo support level below coming in at 0.85769. A close above would likely clear the way for prices to challenge a weekly support flip level seen at 0.89972, and likewise a close below will likely attract further selling down to a major weekly demand area at 0.80646-0.84601, which lines up perfectly with the lower limits of the down-trend channel.
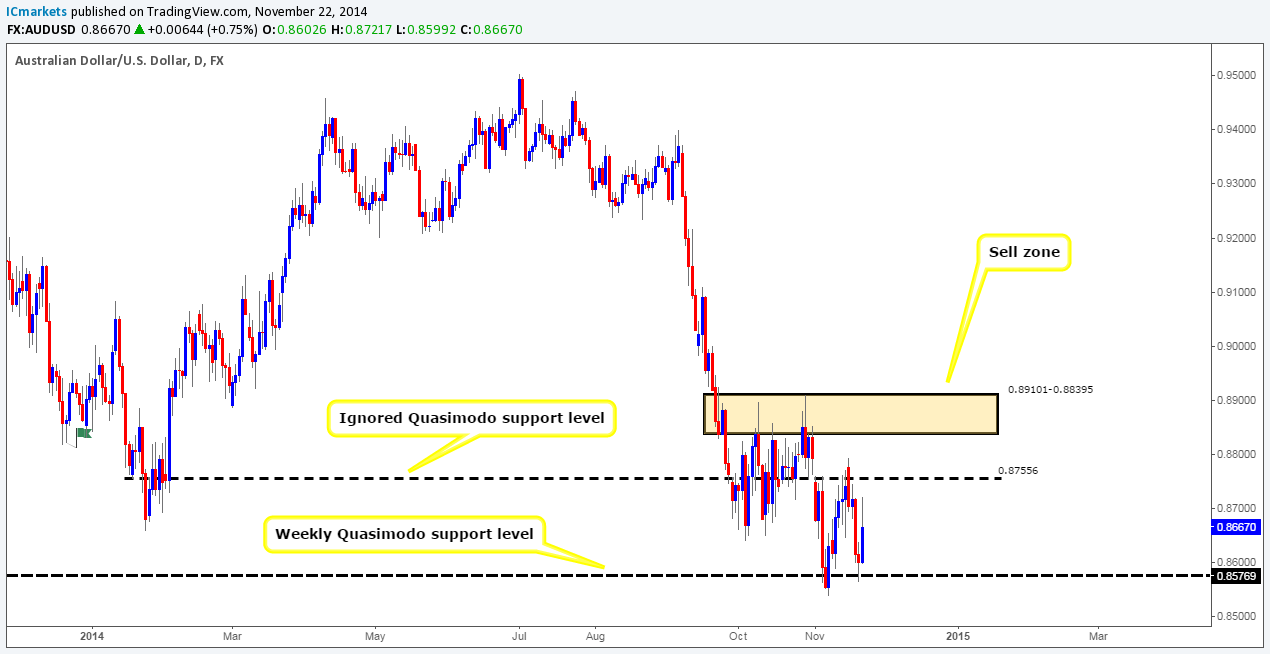
Daily Timeframe: At the time of writing, the buyers and sellers are seen trading between 0.85769 (weekly Quasimodo support), and 0.87556, an ignored daily Quasimodo support level. A break above would likely attract further buying up to a daily ‘sell zone’ coming in at 0.89101-0.88395, and likewise, a push lower could encourage follow-through selling down to a nice-looking daily demand area coming in at 0.83147-0.84336 (seen within the aforementioned major weekly demand area).
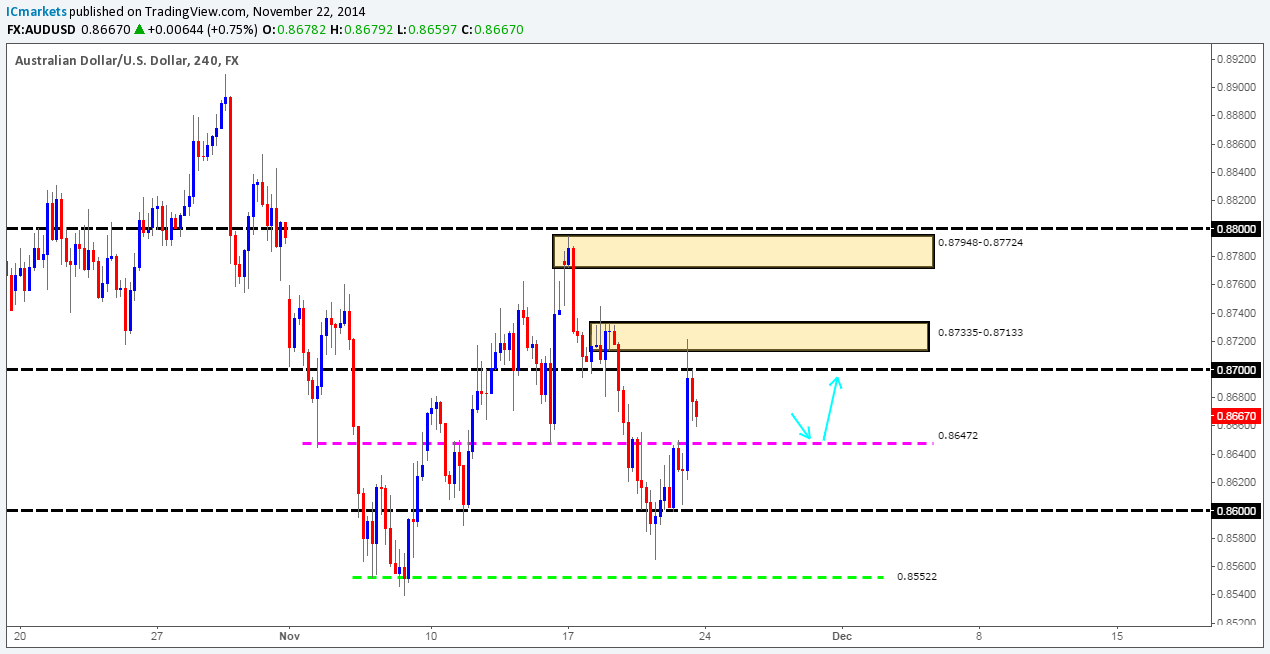
4hr Timeframe: Friday saw prices rally higher, breaking above 0.87 and reacting nicely off of a 4hr supply area coming in at 0.87335-0.87133.
As we already know, both the weekly and daily timeframes are currently in a phase of consolidation, and as such, any trade taken on the AUD/USD at the moment should have small – easily managed profit targets.
With that being said, there may be a short-term buying opportunity to take advantage of, either today or sometime this week around 0.86503, just above a 4hr support swap level coming in at 0.86472. First take-profit target comes in at 0.86979, just below 0.87. We would advise using lower-timeframe confirmation to enter here, since price could very easily fake below this level leading to an unnecessary loss.
Buy/sell levels:
- Buy orders: 0.86503 [Tentative] (Predicative stop-loss orders seen at: Dependent on how one confirms this level).
- Sell orders: N/A (Predicative stop-loss orders seen at: N/A).
USD/JPY:
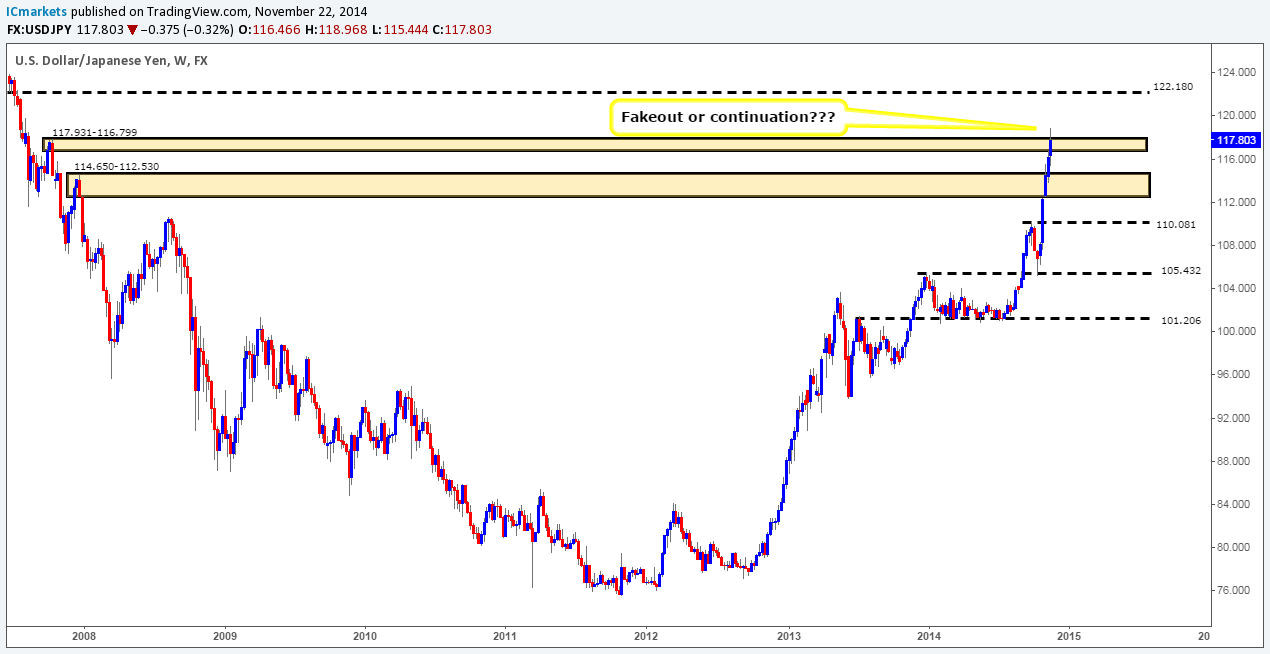
Weekly Timeframe: Last week saw the USD/JPY pair advance to a fresh high of 118.968 as price continued to rally. This move consequently spiked above a major weekly supply area coming in at 117.931-116.799. Was this spike a fakeout to gather liquidity for lower prices, or a continuation move for a rally higher? Hopefully the lower timeframes can help.
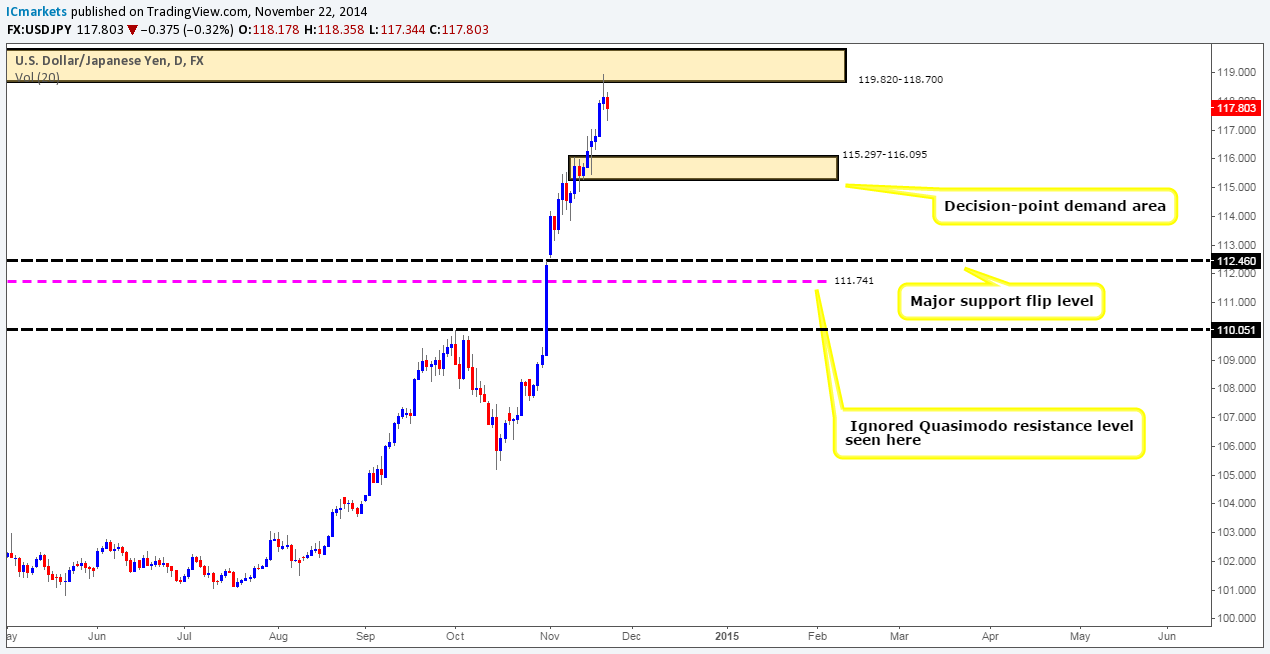
Daily Timeframe: The daily timeframe shows that price has reacted nicely off of a daily supply area coming in at 119.820-118.700. With this being the case, for the current weekly spike to be a fakeout, follow-through selling would need to be seen from here, preferably closing below a daily decision-point demand area coming in at 115.297-116.095. On the other hand, if price breaks above and consumes the daily supply area, we know with a high probability that prices will continue higher.
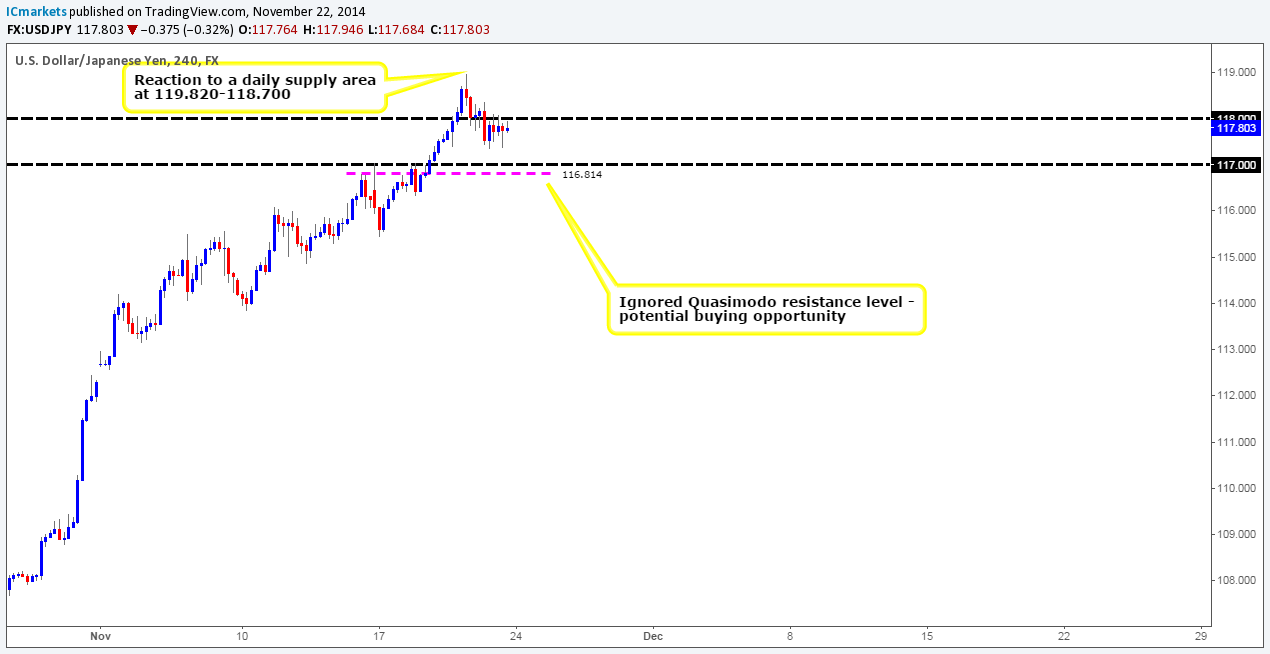
4hr Timeframe: It was mentioned in the previous analysis that we were very tempted to buy at market off of 118. However, we resisted the temptation and chose to wait for confirmation on the lower timeframes which was not seen. Following that, price broke below 118 late on Thursday, and respected this level as resistance throughout Friday’s trading sessions.
Assuming that the sellers can hold out below 118, we see very little stopping price from declining in value down to at least 117, or even the 4hr ignored Quasimodo resistance level seen at 116.814. In our opinion, this move would still not be enough to conclude a fakeout happened on the weekly timeframe, and as such it would be around the 116.814 area (116.917) that buyers could come back into the market. In our humble opinion, setting a pending buy order here would be too risky; lower-timeframe confirmation would be needed as price could easily continue down towards 116.095, the upper limit of the aforementioned daily decision-point demand area.
Buy/sell levels:
- Buy orders: 116.917 [Tentative] (Predicative stop-loss orders seen at: Dependent on how one confirms this level).
- Sell orders: N/A (Predicative stop-loss orders seen at: N/A).
EUR/GBP:
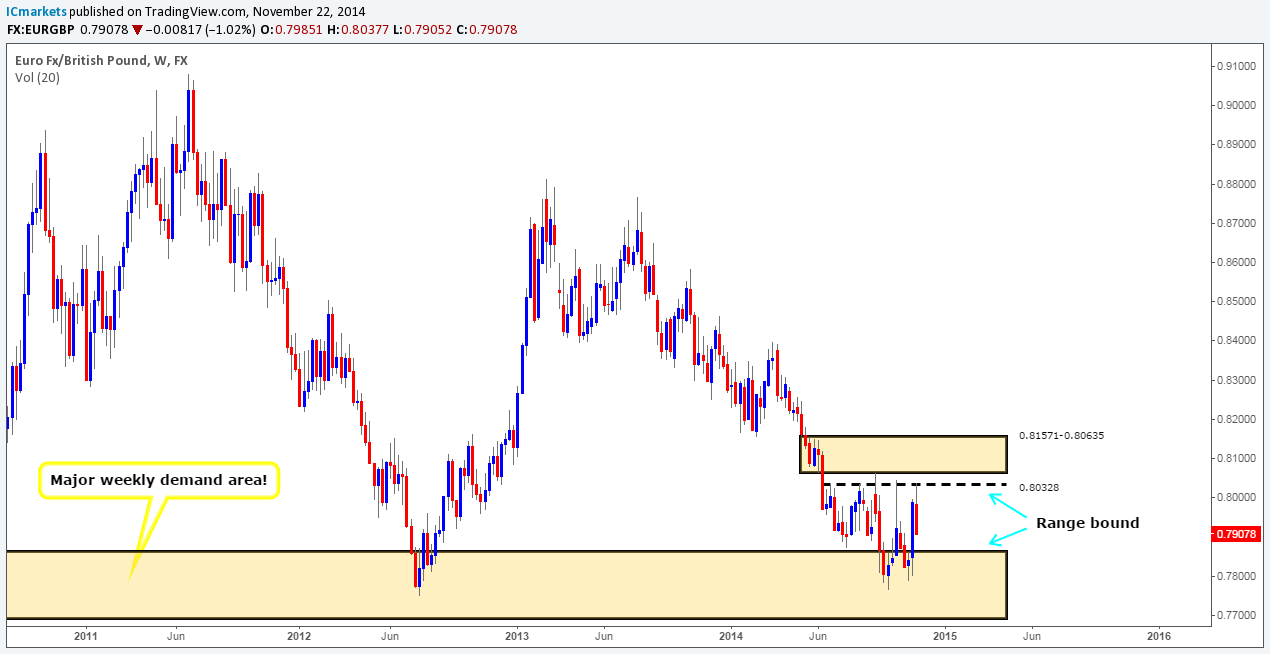
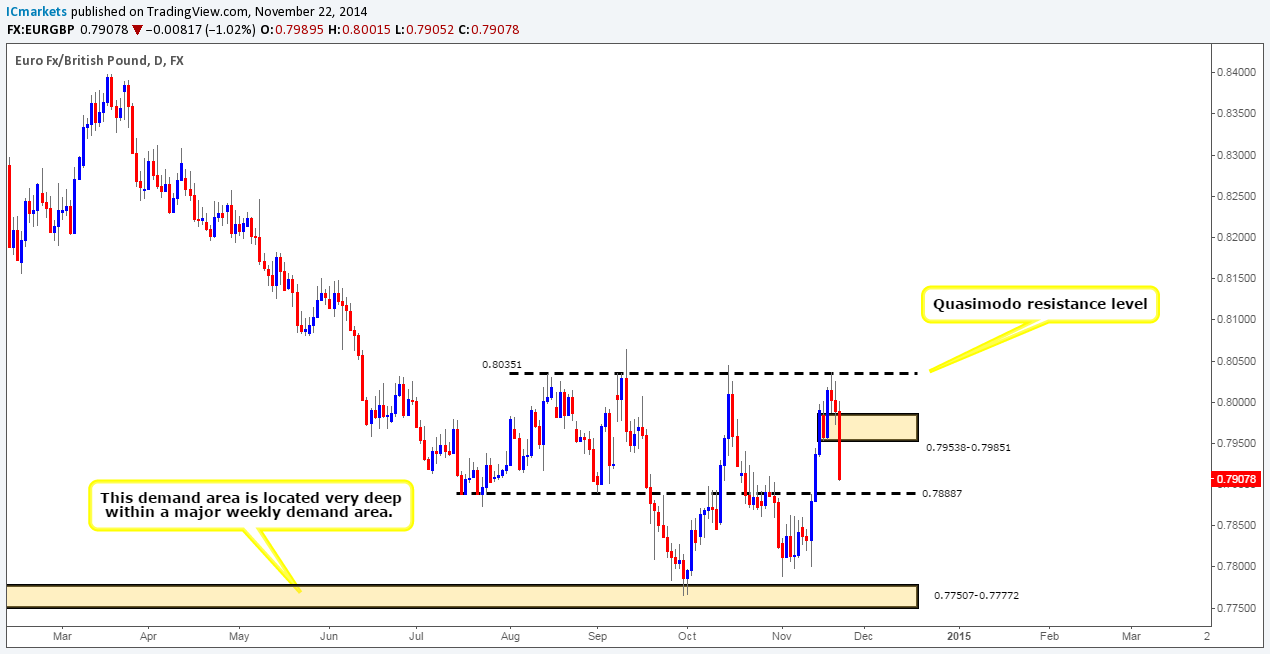
Weekly Timeframe: The EUR/GBP pair shows that price still remains confined between a major weekly demand area at 0.76931-0.78623, and a weekly resistance level coming in at 0.80328. Last week saw the upper limits of this range tested once again, and was clearly enough to allow sellers to come into the market at 0.80377. Will further selling be seen this week? Let’s take a look on the lower timeframes to see what we can find.
Daily Timeframe: Friday saw serious selling interest coming into the market around the 0.80015 mark, consequently breaking below a daily decision-point demand area seen at 0.79538-0.79851. This move has very likely cleared the path south down to at least 0.78887 where active buyers are likely waiting.
4hr Timeframe: For anyone who follows our analysis on a regular basis, you may remember that we recently took two short positions on the EUR/GBP (1. 0.80227, 2. 0.79974), which have now both been closed for a nice profit.
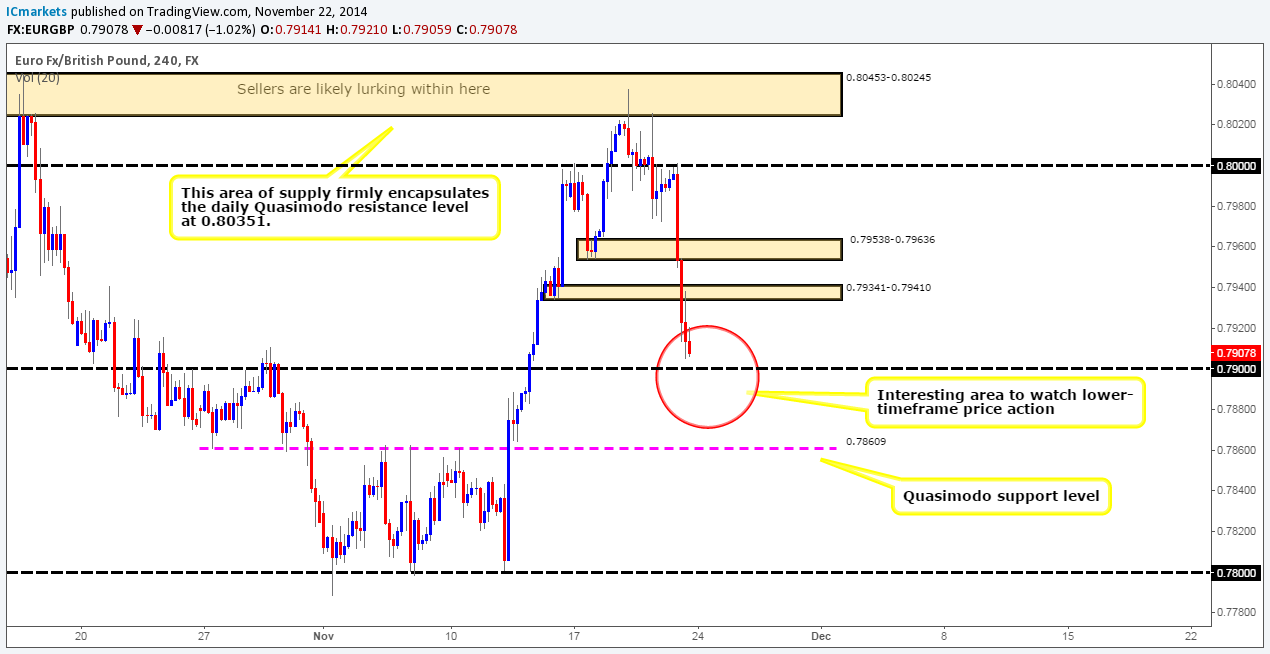
The selling momentum seen on Friday absolutely obliterated two 4hr demand areas (0.79538-0.79636/0.79341-0.79410) which was likely fuelled by Draghi’s (ECB President) speech around the London open.
Risk/reward considerations argue against entering short on this pair with prices in close proximity to both the daily support flip level at 0.78887, and of course the round-number 0.79. So, with the above in mind, this is how we intend to trade this pair. The red circled area is where we plan on watching the lower timeframe action. A break lower with a successful retest would likely get us in short, targeting 0.78652, just above a 4hr Quasimodo support level seen at 0.78609. On the other hand, assuming we get confirmation that 0.79 may hold, we will likely enter long with our first take-profit target being set at 0.79322, just below a 4hr demand swap area at 0.79341-0.79410.
Buy/sell levels:
- Buy orders: N/A (Predicative stop-loss orders seen at: N/A).
- Sell orders: N/A (Predicative stop-loss orders seen at: N/A).
USD/CAD:
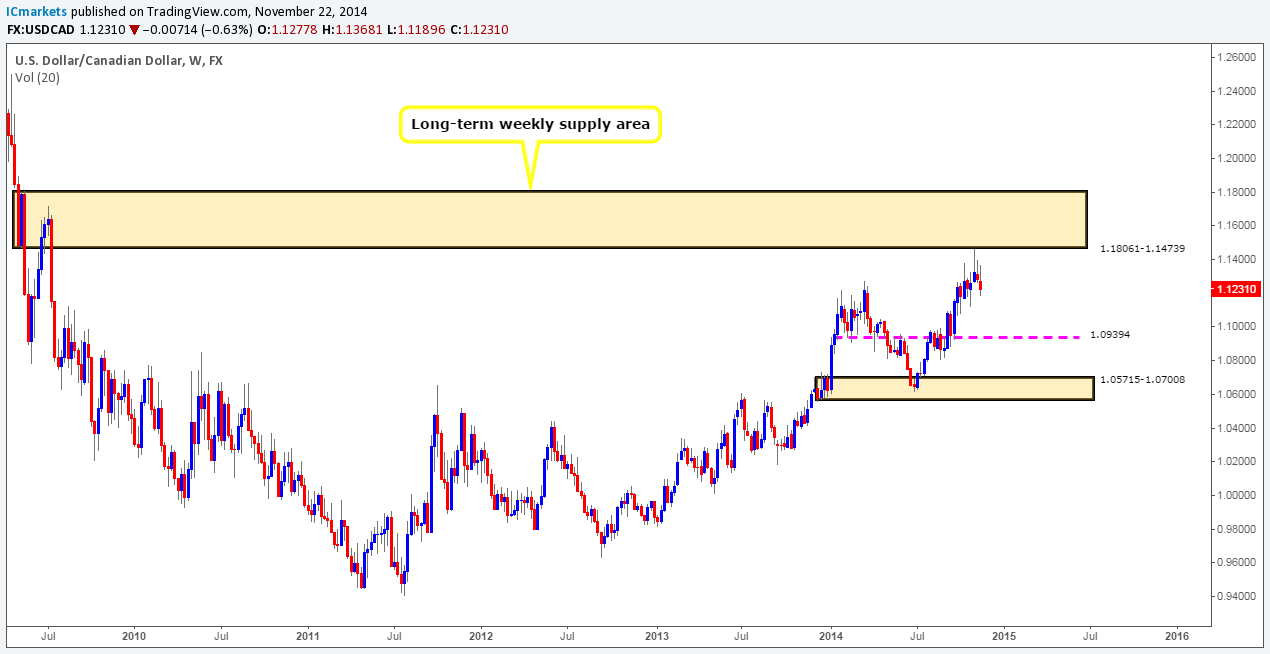
Weekly Timeframe: *New outlook* Three weeks ago, selling interest came into the market a few pips below a major weekly supply area coming in at 1.18061-1.14739, which has consequently encouraged follow-through selling. As per this timeframe, it appears the path south is potentially clear down to at least 1.09394, since we believe most of the near-term demand has already likely been consumed – check out the demand consumption tails seen at 1.11211/1.10807. Let’s see what we can find on the lower timeframes.
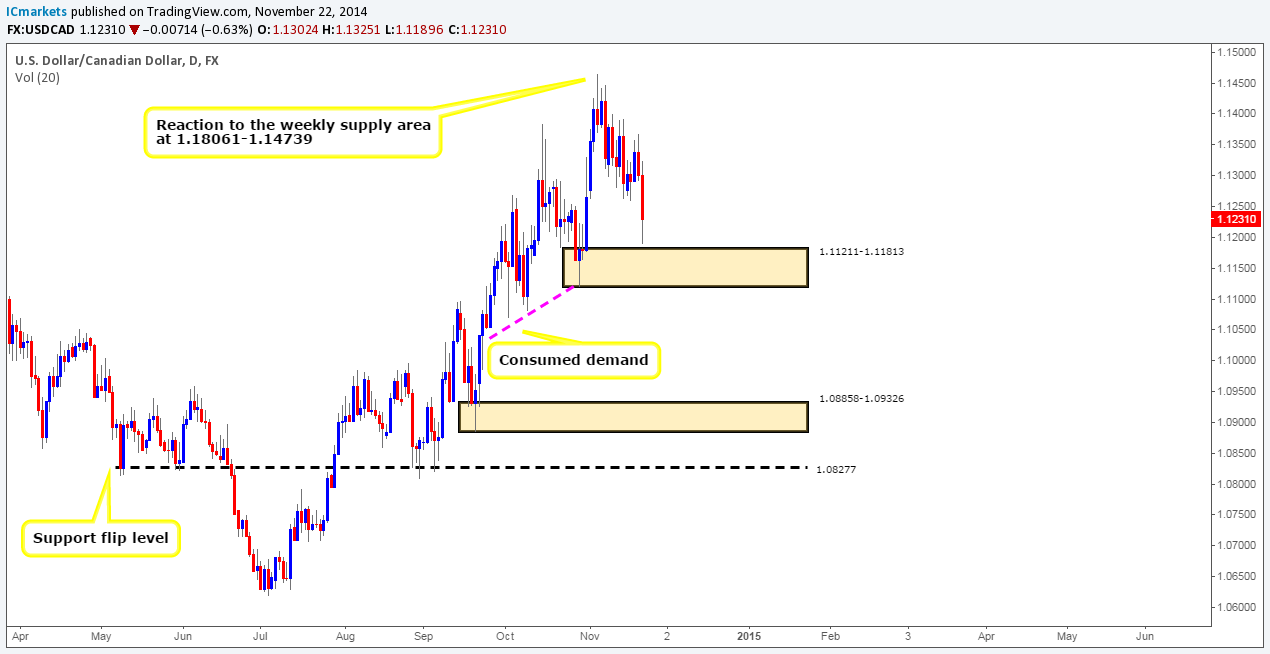
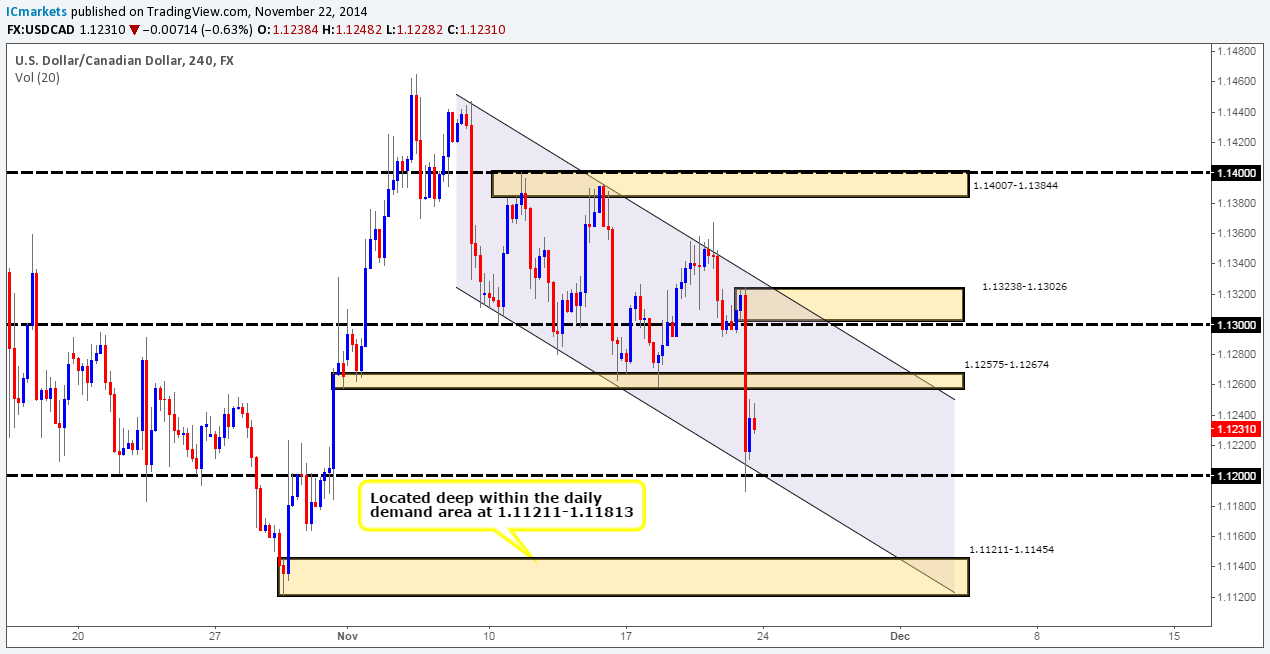
Daily Timeframe: The daily timeframe shows that price is currently trading just above a daily demand area coming in at 1.11211-1.11813. For further selling to be seen, this area of demand will need to be consumed, which could effectively open the gates for prices to challenge a daily demand area seen at 1.08858-1.09326, since to the left all we are seeing is consumed demand (demand consumption tails: 1.10807/1.10704/1.09852).
4hr Timeframe: The 4hr timeframe shows that ever since selling interest came into the market around the weekly supply area mentioned above at 1.10861-1.14739, price has been trading very nicely within a down-trending channel (lower/upper limits – 1.13133/1.14474).
Buying interest has recently come into the market around the 1.12 hurdle, and assuming further buying is seen from here, we can likely expect price to test the 4hr support swap area at 1.12575-1.12674 (tentative sell orders are seen just below at 1.12544). In the event that this area fails and a push higher is seen, the 4hr supply area coming in at 1.13238-1.13026 will likely be hit next. We would be very comfortable placing a pending sell order here if the time comes, since it lines up perfectly with the upper resistance limit of the channel.
Ultimately, what we’re looking for this week is a decline in value to be seen down to a 4hr demand area at 1.11211-1.11454 (located deep within the daily demand area mentioned above at 1.11211-1.11813). It will be here where a decision will need to be made. A break lower would effectively be consuming the higher-timeframe daily demand area as well, and as already mentioned (daily timeframe analysis) this could see prices plummeting. Likewise if the buyers were to hold here and trade higher, this could be an early sign of selling weakness from the weekly supply area mentioned above at 1.10861-1.14739.
Buy/sell levels:
- Buy orders: N/A (Predicative stop-loss orders seen at: N/A).
- Sell orders: 1.12544 [Tentative] (Predicative stop-loss orders seen at: 1.12715).
USD/CHF:
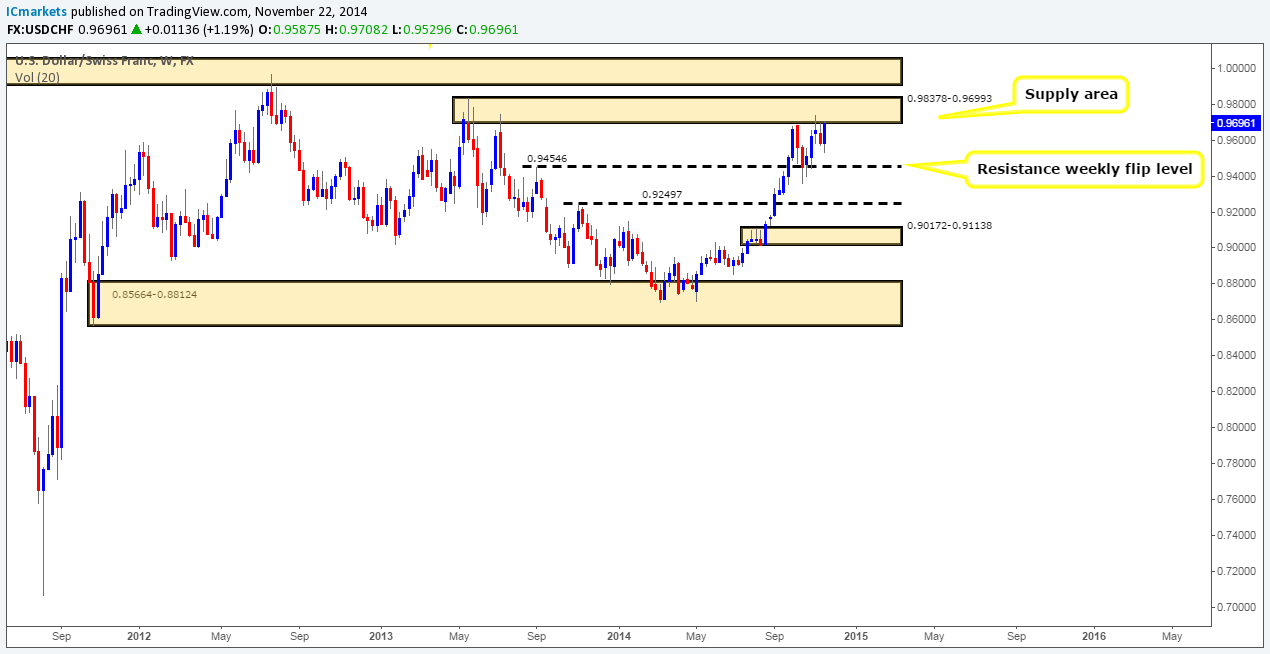
Weekly Timeframe: For the past three weeks now, price has been stalling around a weekly supply area coming in at 0.98378-0.96993, which is obviously not a good sign for anyone who sold here. Let’s take a look at the lower timeframes to see what could potentially be in store for us this week.
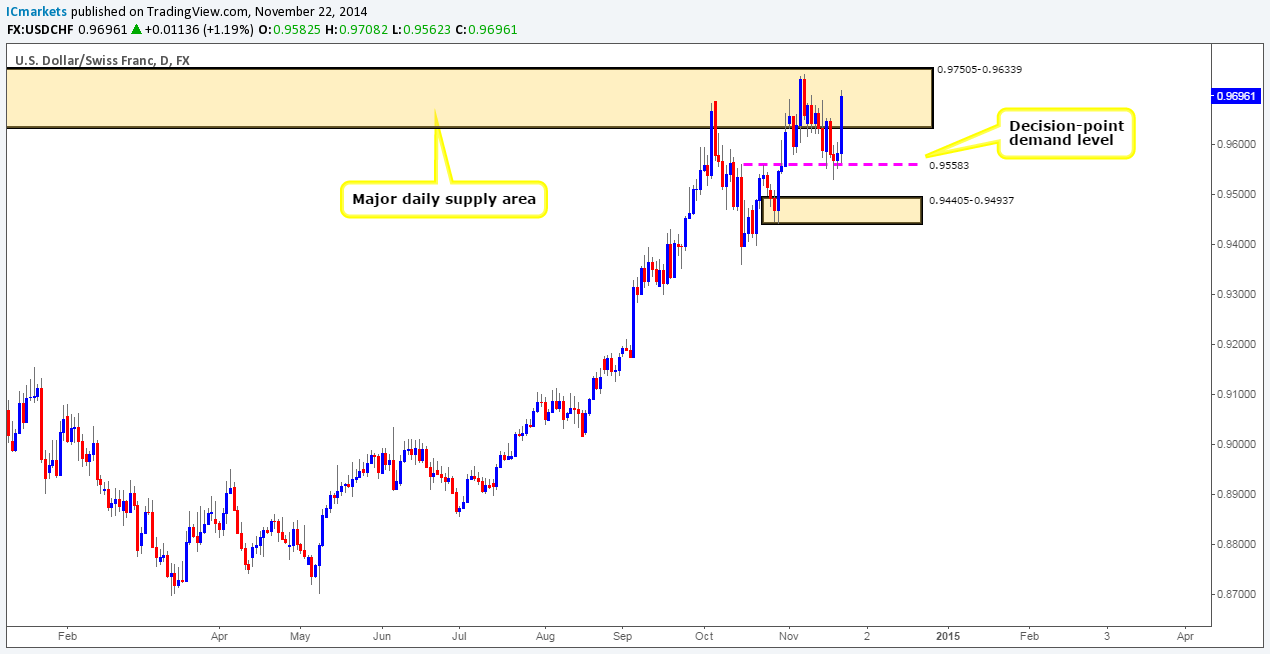
Daily Timeframe: Last week shows that price had been trading between a major daily supply area at 0.97505-0.96339 (located within the aforementioned weekly supply area), and a small daily decision-point demand level coming in at 0.95583. Further selling cannot be seen until this level of demand is consumed. Let’s take a look on the 4hr timeframe to see what else we can find.
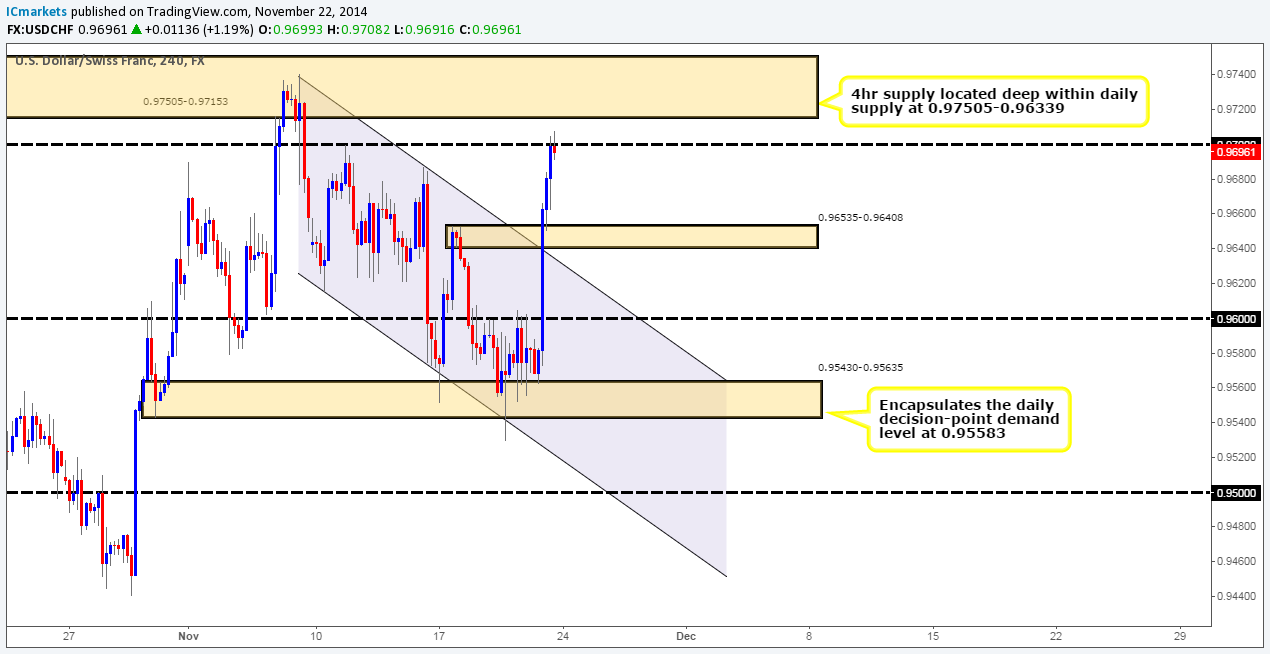
4hr Timeframe: The 4hr timeframe shows that ever since selling interest came into the market around the 4hr supply area at 0.97505-0.97153 (located within both the weekly and daily supply areas (0.98378-0.96993/0.97505-0.96339), price has been neatly trading within a down-trending channel (lower/upper limits: 0.96155/0.97408). That was until Friday’s trading sessions broke above the upper resistance limit, and rocketed prices north towards 0.97.
We feel there is a good chance that a reversal will be seen early this week sometime, due to the fact that traders will want to lock in profits from the recent rally higher. As a consequence, this will cause prices to decline. We are currently looking to enter long around 0.96568, just above an ignored 4hr supply area at 0.96535-0.96408. The reason for this is simply because we believe the higher timeframe supply areas are weakening, and a breakout higher will likely be seen soon. For anyone who is considering taking this trade as well, we would recommend not entering blindly here with a pending buy order. Lower-timeframe confirmation will be required beforehand, simply because prices could continue to slide down towards 0.96, which lines up ever so beautifully with the upper resistance limit (now support) of the channel.
Buy/sell levels:
- Buy orders: 0.96568 [Tentative] (Predicative stop-loss orders seen at: 0.96373).
- Sell orders: N/A (Predicative stop-loss orders seen at: N/A).
XAU/USD (GOLD):
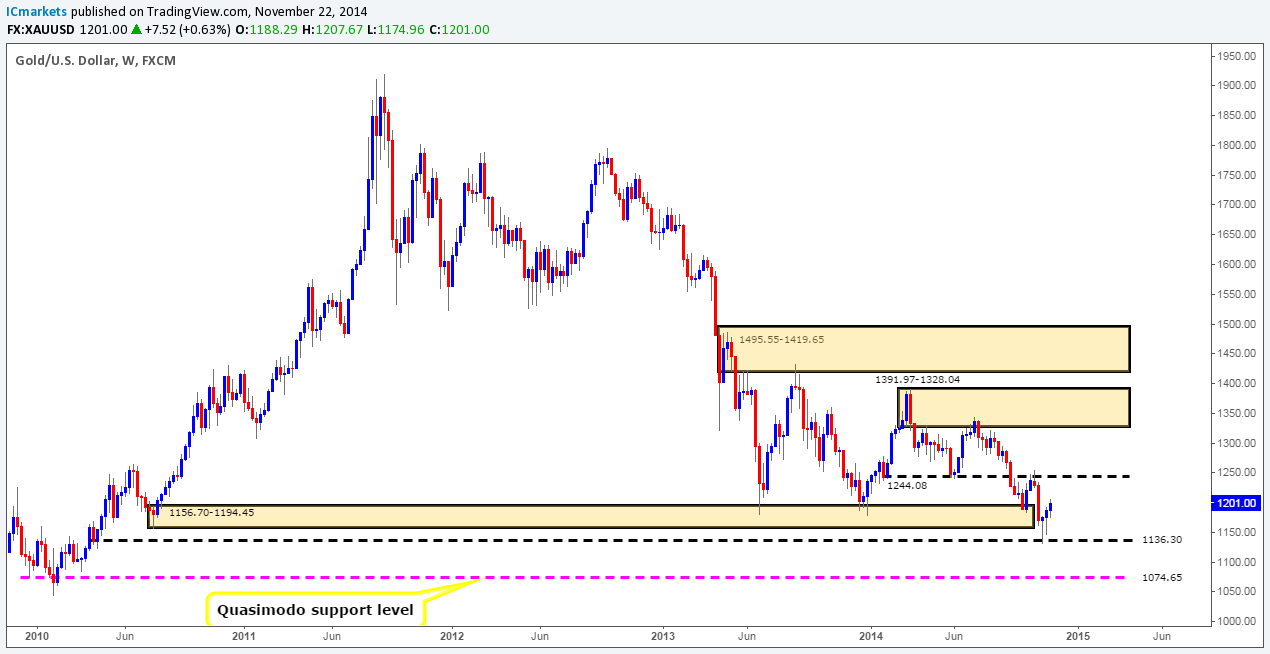
Weekly Timeframe: The weekly timeframe shows that price has extended higher recently, which as a result will likely add confidence to the buying strength currently being seen off of the weekly decision-point demand level at 1136.30. At the time of writing, there seems very little resistance in the way that could stop prices challenging 1244.08 once again. Let’s see what the lower timeframes are showing.
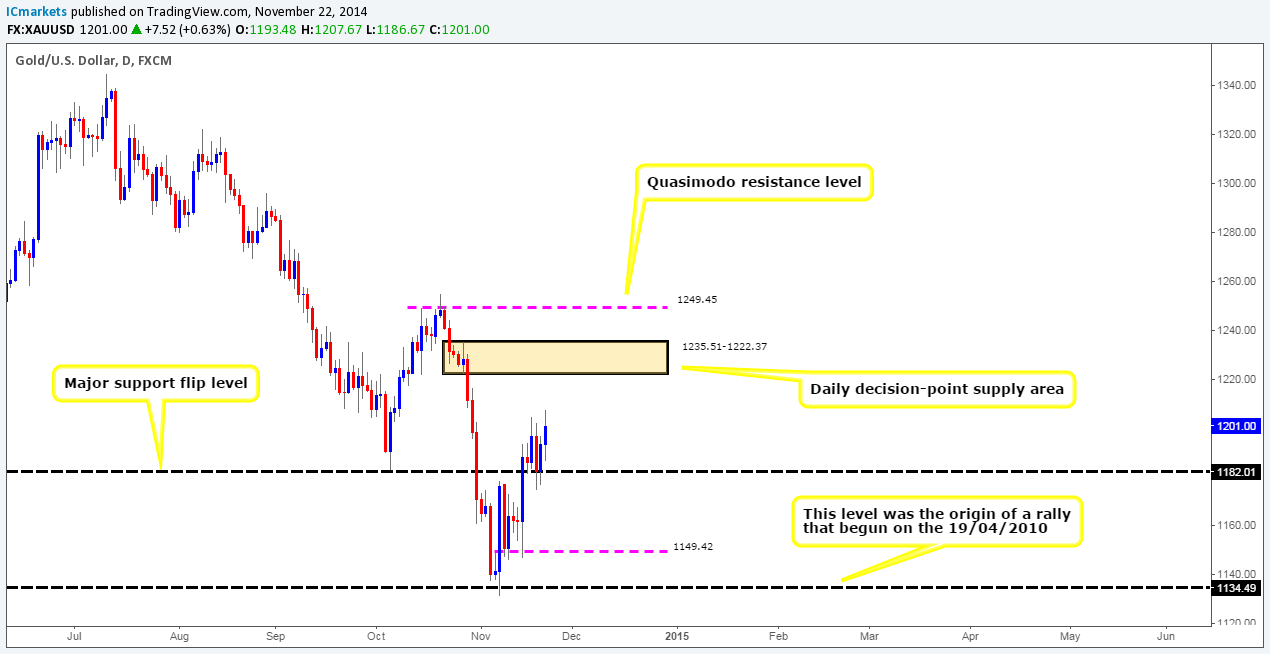
Daily Timeframe: The daily timeframe is also showing strength due to the fact that the buyers have successfully held above a major daily support flip level seen at 1182.01. The path north appears to be relatively clear up to at least a daily decision-point supply area coming in at 1235.51-1222.37, just below the weekly 1244.08 level.
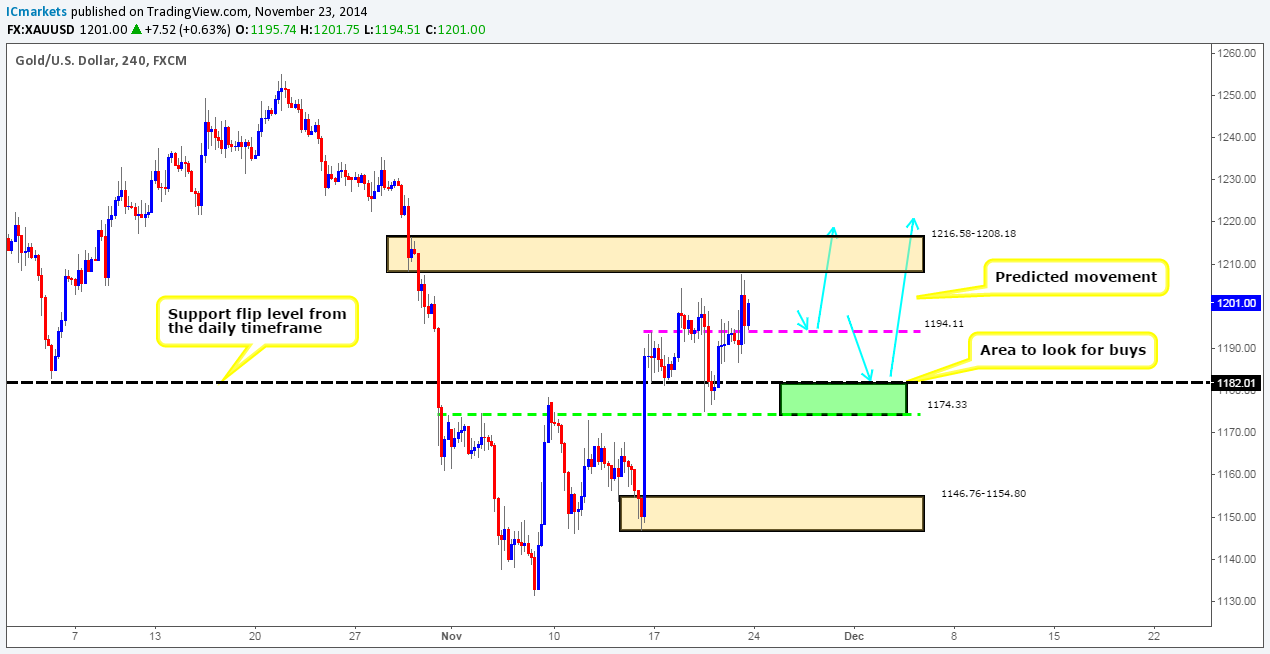
4hr Timeframe: Friday’s trading action shows that price attempted to trade higher, but found the 4hr supply area at 1216.58-1208.18 to be too strong to overcome. As a consequence, this forced the market lower down to around 1194.11, a small 4hr resistance flip level, where at which point buying interest was seen just before the market closed for the week at 1201.00.
With both the weekly and daily timeframes indicating that the market will likely trade higher this week, let’s see if we can find a nice level or two to trade long from.
Buying around 1195.20, just above a 4hr resistance flip level seen at 1194.11 could potentially be valid if we see confirmation from the lower timeframes. Failing that, a beautiful area to look for buying opportunities would be between the daily support flip level (1182.01), and minor 4hr resistance flip level (1174.33), marked with a green rectangle. This area likely has enough buyers to rally prices higher and push above the aforementioned 4hr supply area (as per the blue arrows).
Buy/sell levels:
- Buy orders: 1195.20 [Tentative] (Predicative stop-loss orders seen at: Dependent on how one confirms the level).
- Sell orders: N/A (Predicative stop-loss orders seen at: N/A).
Source:: Monday 24th November: Weekly technical outlook and review (Japanese bank holiday today).


